
Fig. 5
- ID
- ZDB-FIG-250219-5
- Publication
- Bouwman et al., 2025 - Cross-species comparison reveals that Hmga1 reduces H3K27me3 levels to promote cardiomyocyte proliferation and cardiac regeneration
- Other Figures
- All Figure Page
- Back to All Figure Page
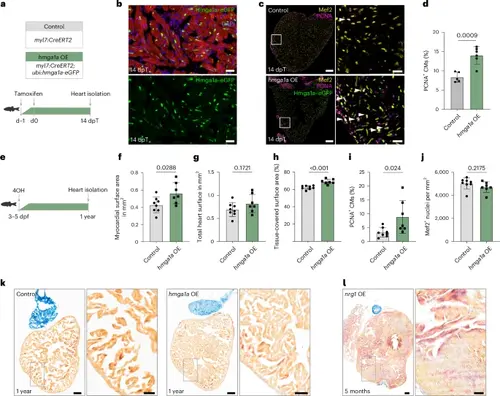
hmga1a OE stimulates CM proliferation resulting in myocardial expansion without pathological remodeling. a, Workflow of tamoxifen treatment for 14 days of hmga1a OE used in b–d. b, Representative images of immunofluorescent staining for GFP, α-actinin and DAPI on a Tg(ubi:Loxp-stop-Loxp-hmga1a-eGFP, myl7:CreERT2) heart at 14 dpT. n = 6 hearts were analyzed. CM-specific nuclear Hmga1a–eGFP can be observed in most CMs. Scale bars, 20 μm. c, Representative images of immunofluorescent staining against Mef2, PCNA and Hmga1a–eGFP on 14-dpT control and hmga1a OE hearts. Arrowheads indicate proliferating CMs. Overview scale bars, 100 μm; zoom-in scale bars, 20 μm. d, Quantification of proliferating CMs in control (n = 5) and hmga1a OE (n = 6) hearts at 14 dpT. Datapoints represent individual hearts. Error bars indicate mean ± s.d. Statistics were performed by two-tailed unpaired t-test and show a significant difference between control and hmga1a OE (P = 0.0009). e, Workflow of tamoxifen treatment for long-term hmga1a OE used in f–k. dpf, days post fertilization; 4OH, 4-hydroxytamoxifen. f–j, Quantification of differences between control (n = 8) and hmga1a OE (n = 9) hearts, including myocardium-covered surface area (P = 0.0288) (f), total heart surface (myocardium + lumen) (P = 0.1721) (g), the percentage of total heart surface covered with myocardium (P < 0.001) (h), the percentage of proliferating CMs (P = 0.024) (i) and the density of cardiomyocyte nuclei (P = 0.2175) (j). Datapoints represent individual hearts. Error bars indicate mean ± s.d. Statistics were performed using two-tailed unpaired t-tests. k,l, Representative images of AFOG staining on a 1-year control and hmga1a OE zebrafish heart (k) and a 5-month nrg1 OE Tg(β-actin2:loxPmTagBFP-STOP-loxP-Nrg1) heart (l) showing muscle in orange, fibrin in red and collagen in blue. n = 8 control, n = 9 hmga1a OE and n = 1 nrg1 OE hearts were analyzed. Scale bars, 100 μm in the overviews and 50 μm in the zoom-ins. |