
Fig. 6
- ID
- ZDB-FIG-250219-6
- Publication
- Bouwman et al., 2025 - Cross-species comparison reveals that Hmga1 reduces H3K27me3 levels to promote cardiomyocyte proliferation and cardiac regeneration
- Other Figures
- All Figure Page
- Back to All Figure Page
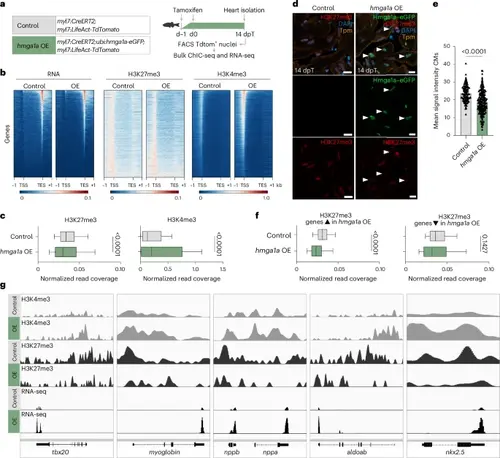
Reduction of repressive H3K27me3 marks by hmga1a OE in zebrafish CMs. a, Schematic overview for bulk sortChIC (control n = 10, hmga1a OE n = 10) and RNA-seq (control n = 14, hmga1a OE n = 14). b, Heatmap showing read distribution of RNA expression and levels of H3K27me3 and H3K4me3 in control and hmga1a OE CMs. TSS, transcription start site; TES, transcription end site; −1 and +1 indicate the kilobase distance from TSS or TES. c, Quantification of histone mark levels on all genes, comparing normalized read coverage in control versus hmga1a OE CMs. H3K27me3 levels (peak data on n = 21,440 genes) are significantly reduced on gene bodies (P < 0.001), and H3K4me3 levels (peak data on n = 21,843 genes) are significantly increased on promoter regions in hmga1a OE CMs (P < 0.001). Center line indicates median; whiskers indicate 10th/90th percentiles. Statistics were performed using two-tailed unpaired t-tests. d, Representative images of immunofluorescent staining for H3K27me3, tropomyosin (Tpm), Hmga1a–eGFP and DAPI on 14-dpT control and hmga1a OE hearts. Arrowheads indicate Hmga1a–eGFP+ CMs with low H3K27me3. Scale bars, 5 μm. e, Quantification of H3K27me3 signal intensity in single CMs of 14-dpT control (n = 8) versus hmga1a OE (n = 8) hearts. Datapoints represent single CM nuclei measured. Error bars indicate mean ± s.d. Statistics were performed using a one-way ANOVA followed by Tukey’s multiple comparisons test and show a significant difference (P < 0.0001). f, Quantification of H3K27me3 levels on genes upregulated in hmga1a OE CMs (peak data on n = 1,141 genes) and genes downregulated in hmga1a OE CMs (peak data on n = 1,001 genes), comparing normalized read coverage in control versus hmga1a OE CMs. H3K27me3 levels were significantly reduced on gene bodies (P < 0.001) of genes upregulated in hmga1a OE CMs but not significantly different between control and hmga1a OE CMs on gene bodies of genes downregulated upon hmga1a OE. Center line indicates median; whiskers indicate 10th/90th percentiles. Statistics were performed using two-tailed unpaired t-tests. g, Genome tracks of example genes that were significantly upregulated in 14-dpT hmga1a OE CMs and were found downstream of Hmga1a (modules 5–8 in the scRNA-seq). |