
Fig. 1
- ID
- ZDB-FIG-250218-76
- Publication
- Wang et al., 2025 - Direct lysine dimethylation of IRF3 by the methyltransferase SMYD3 attenuates antiviral innate immunity
- Other Figures
- All Figure Page
- Back to All Figure Page
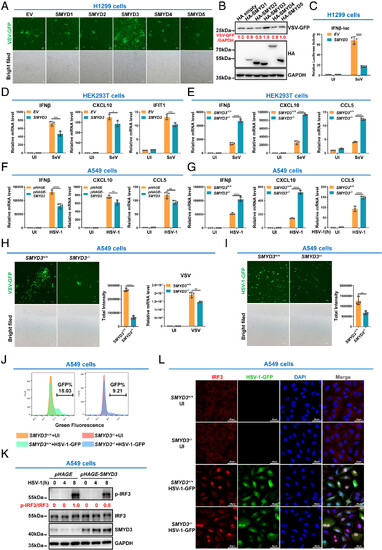
SMYD3 attenuates the cellular antiviral immune response. (A and B) The effect of ectopic expression of SMYDs on VSV-GFP replication in H1299 cells. (C) Luciferase activity of IFNβ promoter reporter in H1299 cells transfected with empty pCMV vector (EV) or pCMV-SMYD3 for 24 h, followed by uninfected (UI) or infected with SeV for 8 h. (D) qPCR analysis of IFNβ, CXCL10, and IFIT1 mRNA in HEK293T cells transfected with empty pCMV EV or pCMV-SMYD3, followed by UI or infected with SeV. (E) qPCR analysis of IFNβ, CXCL10, and CCL5 mRNA in SMYD3-intact (SMYD3+/+) or SMYD3-null (SMYD3−/−) HEK293T cells. (F) qPCR analysis of IFNβ, CXCL10, and CCL5 mRNA in A549 cells infected with pHAGE lentivirus (control) or pHAGE-SMYD3 lentivirus, followed by UI or infected with HSV-1 for 8 h. (G) qPCR analysis of IFNβ, CXCL10, and CCL5 mRNA in SMYD3-intact (SMYD3+/+) or SMYD3-null (SMYD3−/−) A549 cell UI or infected with HSV-1 for 8 h. (H) Microscopic imaging (Left panels) and viral mRNA detection (Right panels) of VSV replication in SMYD3-intact (SMYD3+/+) or SMYD3-null (SMYD3−/−) A549 cells. (I) Microscopy imaging of HSV-1-GFP virus replication in SMYD3-intact (SMYD3+/+) or SMYD3-null (SMYD3−/−) A549 cells. (J) Flow cytometric analysis of HSV-1 GFP virus replication in SMYD3-intact (SMYD3+/+) or SMYD3-null (SMYD3−/−) A549 cells UI or infected with HSV-1-GFP virus for 8 h. (K) Phosphorylation of IRF3 in A549 cells infected with pHAGE lentivirus (control) or pHAGE-SMYD3 lentivirus, followed by HSV-1 infection for 0, 4, and 8 h. Quantification for phosphorylation of IRF3 was shown in red. (L) Microscopic imaging of IRF3 localization in SMYD3-intact (SMYD3+/+) or SMYD3-null (SMYD3−/−) A549 cells UI or infected with HSV-1-GFP for 8 h. *P < 0.05, **P < 0.01, ***P < 0.001, and ****P < 0.0001. Graphs represent fold induction relative to the untreated cells. Data are presented as the mean values of a representative experiment performed in triplicate (C–G, and H) or as representative data (A, B, H, I, J, and L); these experiments were repeated independently at least three times, and error bars indicate S.D. |