
Fig. 4
- ID
- ZDB-FIG-250218-71
- Publication
- Debaenst et al., 2025 - Crispant analysis in zebrafish as a tool for rapid functional screening of disease-causing genes for bone fragility
- Other Figures
- All Figure Page
- Back to All Figure Page
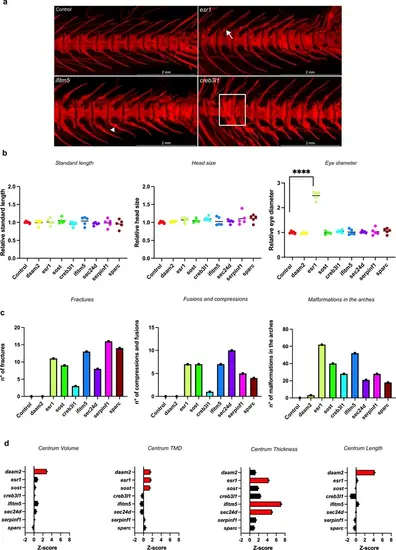
Skeletal phenotyping of adult crispants and their respective controls. The first three genes are associated with the pathogenesis of osteoporosis, while the last five are linked to osteogenesis imperfecta. (a) Pictures of ARS-stained vertebral column of a control and three crispants (from left to right: esr1, ifitm5 and creb3l1), showing fractures (arrow), fusions and compressions (squared) and malformations in the arches (arrowhead). (b) Measurements of the standard length, the head size and the eye diameter of the crispants compared to their control. The standard length was measured from the snout tip to the tail base. The head size was measured from the snout tip to the supraoccipital bone and the eye diameter was measured from the lateral ethmoid to the hyomandibula. The data was normalized for easier visualization (normalization = individual value crispants (or controls) / mean control (n=5)). (c) Quantification of the number of fractures, fusions or compressions and malformations in the arches of crispants and the controls. For this quantification, twelve vertebrae were selected per fish and a total of 5 crispants per assay was evaluated. Statistical analysis was evaluated using the Mann-Whitney U -test on non-normalized data and significant differences were visualized using an asterix (*=p ≤ 0.05; **=p ≤ 0.01; ***=p ≤ 0.001; ****=p ≤ 0.0001). Error bars showed the standard deviation of non-normalized data. (d) Quantification of skeletal parameters by quantitative micro-computed tomography (μCT) analysis. In the graphical representation, the different crispants were listed. Statistically significant differences from the control values for a given crispant were depicted as red bars. Significance levels were determined through the global test analysis (Figure 4—figure supplement 2). |