FIGURE
            Fig. 9
- ID
 - ZDB-FIG-250120-53
 - Publication
 - Karimzadeh et al., 2024 - Fat mass and obesity associated gene and homeobox transcription factor iriquois-3 mRNA profiles in the metabolic tissues of zebrafish are modulated by feeding and food deprivation
 - Other Figures
 - All Figure Page
 - Back to All Figure Page


                        Fig. 9


| 


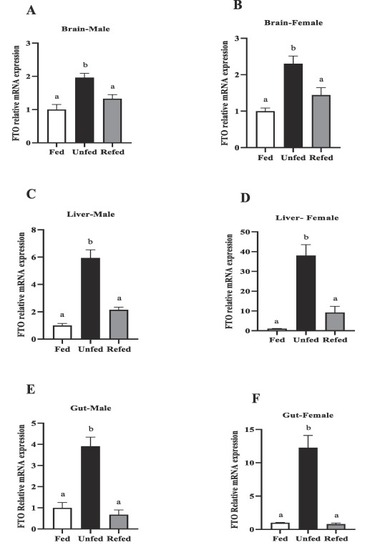
 FTO mRNA abundance in the metabolic tissues of male and female zebrafish during 7-day food deprivation and 24 h post-feeding (refed group). Brain (A–B), liver (C–D( and gut (E,F). FTO mRNA expression was normalized to β-actin and 18S. Different letters above bars indicate significant differences between groups (one-way ANOVA followed by Student-Newman-Keul’s post-hoc test, P < 0.05). Asterisks represent significant differences among the groups at the same time point (Student’s t-test; (*p < 0.05, **p < 0.01, ***p < 0.001 ****p < 0.0001). Data are expressed as mean ± SEM (n = 6 zebrafish/group).  | 


                        Expression Data


    | Gene: | |
|---|---|
| Fish: | |
| Conditions: | |
| Anatomical Terms: | |
| Stage: | Adult | 
                
                    
                        Expression Detail


                        Antibody Labeling


                        Phenotype Data


    | Fish: | |
|---|---|
| Conditions: | |
| Observed In: | |
| Stage: | Adult | 
                
                    
                        Phenotype Detail


                        Acknowledgments


This image is the copyrighted work of the attributed author or publisher, and
ZFIN has permission only to display this image to its users.
Additional permissions should be obtained from the applicable author or publisher of the image.
      Full text @ Gen. Comp. Endocrinol.