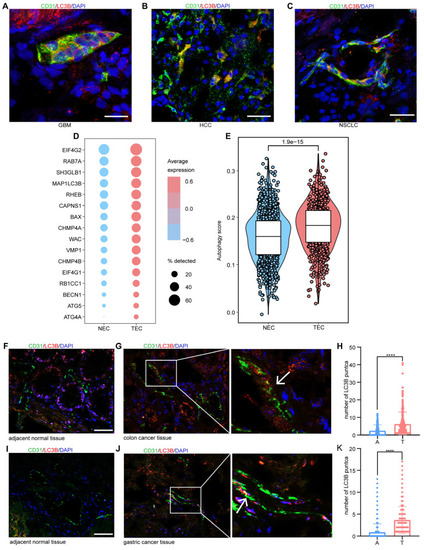
TECs exhibit elevated autophagy levels. A-C: Representative immunofluorescence images showing the expression of autophagy-related protein LC3B (red) in CD31+ vessels (green) in tumor tissues from patients with hepatocellular carcinoma (HCC), glioblastoma (GBM), and non-small cell lung cancer (NSCLC). Scale bars = 20 μm. n = 3 patients per group. D: Dot plot visualization of autophagy-related gene expression in NECs and TECs. The x-axis represents the tissue source (NEC or TEC), whereas the y-axis lists the autophagy-related genes. Dot size indicates the percentage of samples in which each gene was detected, and dot color represents the average gene expression level across samples. The color scale ranges from blue (low expression) to red (high expression). E: Comparison of autophagy gene expression scores between NECs and TECs, revealing a statistically significant increase in autophagy-related gene expression in TECs (P-value = 1.9e-15). F-K: Representative immunofluorescence images showing LC3B (red) in endothelial cells (indicated by arrows) within both adjacent normal and tumor tissues from patients with colon and gastric cancer. Box plots (H and K) quantifying the number of LC3B-positive puncta in CD31+ cells from adjacent normal (A) and tumor (T) tissues in colon and gastric cancer samples. Box plots display the maximum and minimum values, medians, and 25th/75th percentiles. P values were calculated using two-tailed Student's t-tests. ****P < 0.0001. Scale bars = 50 μm. n = 3 patients per group.
|
