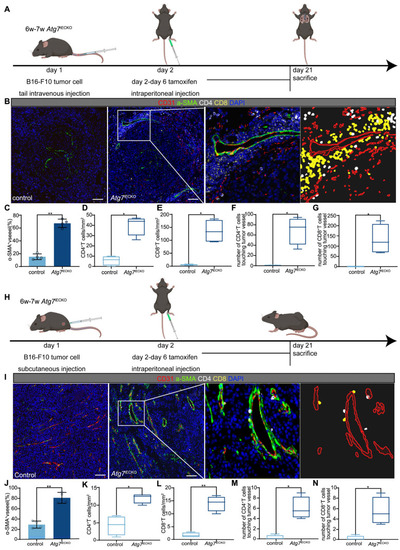
Endothelial autophagy blockade remodels tumor vasculature and enhances perivascular immune niche formation in Atg7iECKO mice. A: Schematic of the experimental timeline for the B16-F10 lung metastasis model in Atg7iECKO mice. On day 2 after the intravenous injection of B16-F10 cells, tamoxifen (20 mg/ml in corn oil) was administered intraperitoneally (2 mg/20 g body weight) for five consecutive days to induce endothelial cell-specific Atg7 knockout. Tumor tissues were harvested 21 d post-transplantation. B: Representative mIF images of tumor sections from control and Atg7iECKO mice, stained for CD31 (endothelial cells, red), α-SMA (pericytes, green), CD4 (helper T cells, white), CD8 (cytotoxic T cells, yellow), and DAPI (nuclei, blue). Right panel: Enlarged view showing T cell aggregates in the perivascular immune niche of Atg7iECKO tumor tissue. Scale bar = 100 μm. C: Quantification of functional tumor vessels, defined as the percentage of CD31+ vessels co-stained with α-SMA. Data are presented as the mean ± SD (n = 4 mice per group; **P < 0.01, Student's t-test). D-G: Quantification of CD4+ and CD8+ T cell density in the tumor stroma and the number of these cells within a 10-μm radius around tumor blood vessels. Data are shown as box plots displaying the minimum, maximum, median, and 25/75 percentiles (n = 4 mice per group; *P < 0.05, **P < 0.01, Student's t-test). H: Schematic of the experimental timeline for the B16-F10 subcutaneous tumor model in Atg7iECKO mice. On day 2 following the subcutaneous injection of B16-F10 cells, tamoxifen (20 mg/ml in corn oil) was administered intraperitoneally (2 mg/20 g body weight) for five consecutive days to induce endothelial cell-specific Atg7 knockout. Tumor tissues were collected on day 21 post-transplantation. I: Representative mIF images of tumor sections from control and Atg7iECKO mice, stained for CD31 (endothelial cells, red), α-SMA (pericytes, green), CD4 (helper T cells, white), CD8 (cytotoxic T cells, yellow), and DAPI (nuclei, blue). Right panel: Enlarged view showing T cell aggregates in the perivascular immune niche of Atg7iECKO tumor tissue. Scale bar = 100 μm. J: Quantification of functional tumor vessels, defined as the percentage of CD31+ vessels co-stained with α-SMA. Data are presented as the mean ± SD (n = 4 mice per group; **P < 0.01, Student's t-test). K-N: Quantification of CD4+ and CD8+ T cell density in the tumor stroma and the number of these cells within a 10-μm radius around tumor blood vessels. Data are shown as box plots displaying the minimum, maximum, median, and 25/75 percentiles (n = 4 mice per group; *P < 0.05, **P < 0.01, Student's t-test).
|