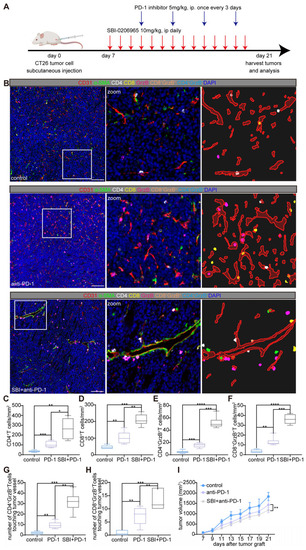
Autophagy inhibitor (SBI-0206965) combined with anti-mouse PD-1 (CD279) induces perivascular immune niches formation and improves the TiME. A: Schematic representation of the treatment regimen used in the CT26 murine subcutaneous tumor model. Mice were treated with the autophagy inhibitor SBI-0206965 (10 mg/kg, intraperitoneally, daily starting from day 7) and an anti-PD-1 antibody (5 mg/kg, intraperitoneally, every 3 d starting on day 11 post-tumor inoculation). Tumor tissues were harvested on day 21 for further analyzes. B: Representative mIF images of tumor sections from the control, PD-1 inhibitor-treated, and combination (SBI-0206965 + PD-1 inhibitor)-treated groups. TiME was stained for CD4+ helper T cells (white), CD8+ cytotoxic T cells (yellow), granzyme B+ cells (GrzB, magenta), endothelial cells (CD31, red), and pericytes (α-SMA, green). Nuclei were stained with DAPI (blue). The zoomed-in regions highlight immune cell distribution and formation of perivascular immune niches in the combination therapy group. Scale bars = 100 μm. C-F:Quantitative analysis of immune cell densities in the tumor stroma, including CD4+ T cells (C), CD8+ T cells (D), CD4+ granzyme B+ T cells (E), and CD8+ granzyme B+ T cells (F). G and H: Quantification of the number of CD4+ granzyme B+ T cells (G) and CD8+ granzyme B+ T cells (H) within a 10-μm radius around tumor vessels. Data are presented as box plots showing the maximum and minimum values, medians, and 25/75 percentiles (n = 7 mice per group; *P < 0.05, **P < 0.01, ***P < 0.001, ****P < 0.0001; One-way ANOVA). I: Tumor volume changes in each treatment group starting on the day of tumor grafting. Tumor growth was significantly reduced in the combination therapy group (**P < 0.01, two-way ANOVA with Bonferroni post-hoc test). Data are represented as the mean ± SEM.
|
