FIGURE

FIGURE 6

ID
ZDB-FIG-241220-8
Publication
Miyamoto et al., 2024 - The dwarf neon rainbowfish Melanotaenia praecox, a small spiny-rayed fish with potential as a new Acanthomorpha model fish: I. Fin ray ontogeny and postembryonic
Other Figures
All Figure Page
Back to All Figure Page
FIGURE 6

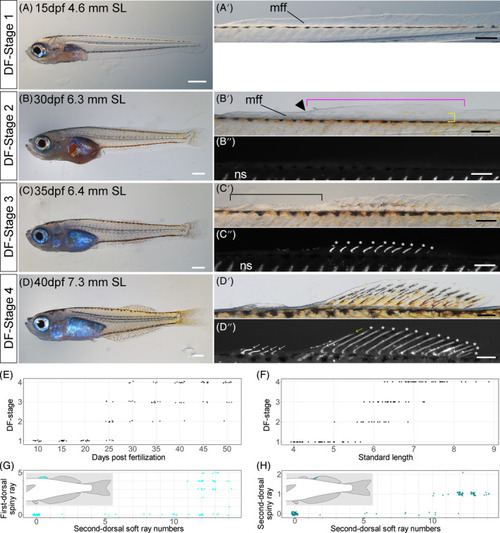
Overview of dorsal fin development in postembryonic stages of Melanotaenia praecox. (A–D″). Lateral views of DF Stages: 1 (A,A′), 2 (B–B″), 3 (C–C″), and 4 (D–D″). Magnified views of dorsal fins are shown in (A′,B′,C′,D′; bright field images) and (B,C″,D″; grayscale fluorescent images). mff, median fin fold; ns, neural spine. Black arrowhead shows the difference in level of the dorsal area of the larval median fin fold. Magenta brackets in (B′) indicate presumptive second dorsal fin area. Yellow brackets in (B′) indicate a clump (condensation) of mesenchymal cells. White asterisks indicate soft rays. Black brackets in (C′) indicate future dorsal fin sites. White arrows in (D″) indicate spiny rays. (E–H) Relationships between: (E) days postfertilization and DF stage; (F) standard length and DF‐stage; and (G, H) numbers of second dorsal soft and spiny rays on the first (G) or second (H) dorsal fin. To reduce data overlap, all points in (E,G,H) are jittered along x and y axes. Schematic drawings in each graph (G,H) indicate the position of each type of fin ray. Scale bars: 500 μm (A–D), and 200 μm (A′,B′,B″,C′,C″,D′,D″).

Expression Data

Expression Detail
Antibody Labeling
Phenotype Data

Phenotype Detail
Acknowledgments
This image is the copyrighted work of the attributed author or publisher, and ZFIN has permission only to display this image to its users. Additional permissions should be obtained from the applicable author or publisher of the image. Full text @ Dev. Dyn.