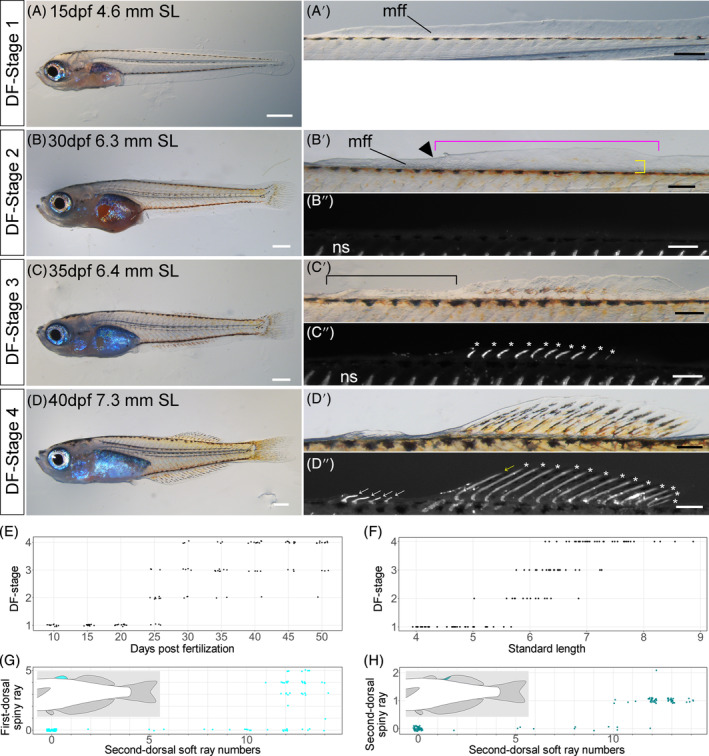
Overview of dorsal fin development in postembryonic stages of Melanotaenia praecox. (A–D″). Lateral views of DF Stages: 1 (A,A′), 2 (B–B″), 3 (C–C″), and 4 (D–D″). Magnified views of dorsal fins are shown in (A′,B′,C′,D′; bright field images) and (B,C″,D″; grayscale fluorescent images). mff, median fin fold; ns, neural spine. Black arrowhead shows the difference in level of the dorsal area of the larval median fin fold. Magenta brackets in (B′) indicate presumptive second dorsal fin area. Yellow brackets in (B′) indicate a clump (condensation) of mesenchymal cells. White asterisks indicate soft rays. Black brackets in (C′) indicate future dorsal fin sites. White arrows in (D″) indicate spiny rays. (E–H) Relationships between: (E) days postfertilization and DF stage; (F) standard length and DF‐stage; and (G, H) numbers of second dorsal soft and spiny rays on the first (G) or second (H) dorsal fin. To reduce data overlap, all points in (E,G,H) are jittered along x and y axes. Schematic drawings in each graph (G,H) indicate the position of each type of fin ray. Scale bars: 500 μm (A–D), and 200 μm (A′,B′,B″,C′,C″,D′,D″).
Acknowledgments
This image is the copyrighted work of the attributed author or publisher, and
ZFIN has permission only to display this image to its users.
Additional permissions should be obtained from the applicable author or publisher of the image.
Full text @ Dev. Dyn.
Your Input Welcome
Thank you for submitting comments. Your input has been emailed to ZFIN curators who may contact you if
additional information is required.
Oops. Something went wrong. Please try again later.