
Fig. 6
- ID
- ZDB-FIG-241209-69
- Publication
- Sridhar et al., 2024 - Uncovering multiscale structure in the variability of larval zebrafish navigation
- Other Figures
- All Figure Page
- Back to All Figure Page
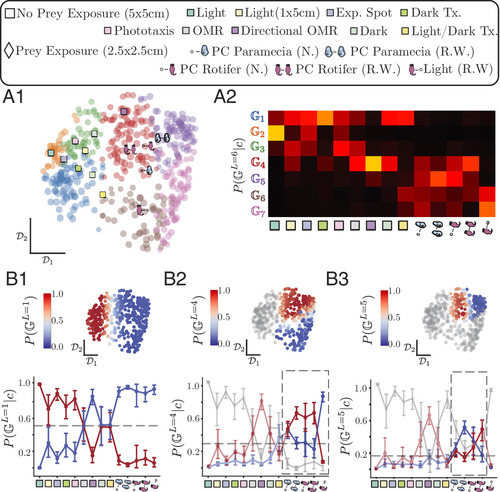
Phenotypic group structure reveals prey exposure as a major determinant of variation. (A1) Transition matrix space of all individuals color-coded by phenotypic groups together with the average position for each condition using symbols detailed above. (A2) Probability of a fish to belong to group in a given experimental condition , : While no sensory context maps onto a phenotypic group, most fish of a given context have preferences for specific groups: fish never exposed to prey often belong to , while fish exposed to prey often belong to groups . (B1–B3) Probability of belonging to group for fish in a condition at different iterations in the hierarchical subdivision (gray line, probability of belonging to neither of the groups): (B1) the first splits fish exposed to prey (during or prior the assay, Right in blue) from fish never exposed to prey (Left in red) (note that the OMR, Dark, and Light/Dark transitions assays are equally distributed across these two groups). (B2) The fourth subdivision distinguishes fish previously exposed to prey but swimming in the light without prey from the fish that had prey in the arena. (B3) At , we find differences stemming from the prey type and prior exposure. In the dashed box, we see that naive fish hunting for the first time split equally, whereas fish raised with either paramecia or rotifers generally belong to distinct groups. |