
Fig. 1
- ID
- ZDB-FIG-241209-64
- Publication
- Sridhar et al., 2024 - Uncovering multiscale structure in the variability of larval zebrafish navigation
- Other Figures
- All Figure Page
- Back to All Figure Page
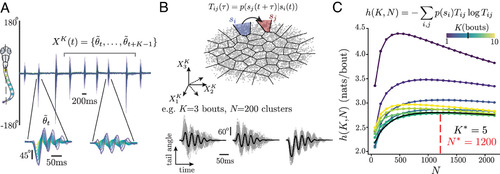
Building a maximally predictive state space for larval zebrafish. (A) Typical example of larval zebrafish locomotion bouts, measured as the cumulative angle made by points on the tail with respect to the midline. An example turn (Left) and forward (Right) bout are shown below. We construct bout sequences (gray bar), increasing the sequence length to maximize predictability. (B) Illustration of the estimation of transition matrices as a function of the number of bouts in a sequence and the number of partitions . We cluster the bout sequence space into discrete microstates and estimate transition probabilities (SI Appendix). Below, we illustrate an example microstate constructed with , : We plot the cumulative tail angle in the bout sequences belonging to the microstate (gray, average in black). (C) To probe the short-time predictability of the dynamics across sensory contexts, we estimate the entropy rate of the transition matrix constructed with for varying and (we sample 7,500 bouts from each sensory context from ref. 11; see SI Appendix). Increasing offers resolution over the bout sequences, while increasing offers predictability. We choose to minimize the entropy rate, and choose to maximize the resolution before finite-size effects result in the underestimation of the entropy rate (33). |