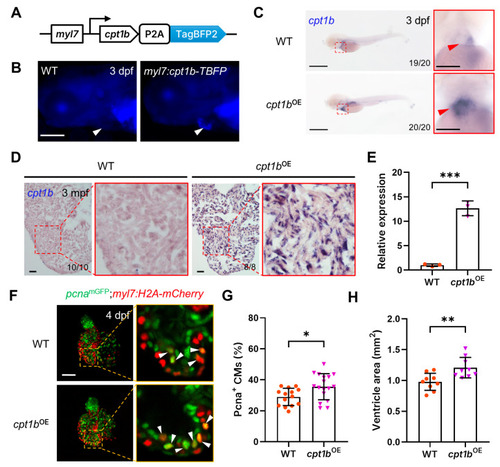
Overexpression of cpt1b promotes cardiomyocyte proliferation in zebrafish embryos. (A) A schematic representation of the Tg(myl7:cpt1b-TBFP) construct. (B) A stereo fluorescence image of a 3 dpf wild-type sibling and Tg(myl7:cpt1b-TBFP) embryos. The triangles indicate the embryonic hearts. Scale bar: 200 µm. (C) Whole-mount in situ hybridization analysis of cpt1b expression with WT and cpt1bOE zebrafish embryos at 3 dpf. The red boxes demarcate enlarged ventral views of the hearts (red triangles). Scale bar: 500 µm. (D) In situ hybridization analysis of cpt1b expression in cryosections of adult WT and cpt1bOE zebrafish hearts. The red boxes show enlarged views of the denoted regions. Scale bar: 50 µm. (E) Quantitative RT-PCR analysis of cpt1b expression in the hearts of adult WT and cpt1bOE zebrafish. *** p < 0.001. (F) Representative maximum intensity projection confocal images of dissected hearts from 3 dpf Tg(pcnamGFP;myl7:H2A-mCherry) and Tg(pcnamGFP;myl7:H2A-mCherry;myl7:cpt1b-TBFP) embryos. Enlarged single optical section images of the boxed regions are shown on the right. White triangles indicate proliferating cardiomyocytes. Scale bar: 50 µm. (G) Quantitative analysis of proliferating cardiomyocytes in F. * p < 0.05. n = 14–17. (H) Quantification of ventricular areas of adult wild-type and cpt1bOE zebrafish. n = 9–10. ** p < 0.01.
|
