
- Title
-
cpt1b Regulates Cardiomyocyte Proliferation Through Modulation of Glutamine Synthetase in Zebrafish
- Authors
- Cheng, X., Ju, J., Huang, W., Duan, Z., Han, Y.
- Source
- Full text @ J Cardiovasc Dev Dis

Loss of |
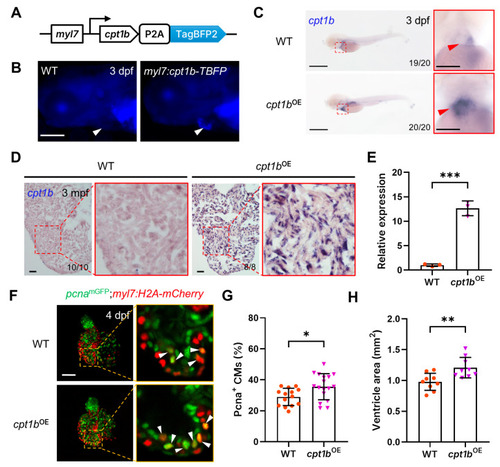
Overexpression of |

Transcriptomic analysis reveals the potential contribution of Glul in |