|
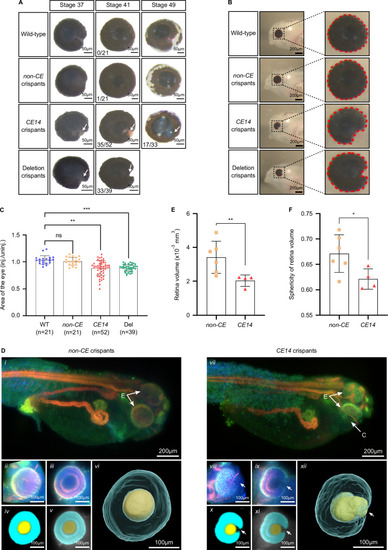
Characterisation of eye size and morphology in Xenopus tropicalis mab21l2 crispant embryos. A Eye phenotypes in wild type (WT) and mab21l2 crispant embryos throughout different developmental stages demonstrating colobomas (abnormal choroid fissure closure; white arrows) in CE14 and deletion crispants. The number of animals showing the abnormal choroid fissure phenotype is indicated. B Outline of the circumference of the eyes (dashed red line) on the injected side of the tadpoles (NF stage 41) indicating the presence of coloboma in CE14 and deletion crispants. C Histogram depicting relative eye size evaluated for individual embryos of wild-type (n = 21), mab21l2-non-CE (n = 21), CE14 (n = 52) and 5’del (n = 39) crispants via 2D measurements of the eye circumference. The ratio of the injected side versus the non-injected side of each group demonstrates a significant reduction in eye size on the injected side of CE14 (p = 0.0013) and deletion crispants (p = 0.0007) compared to WT, while non-CE has a similar ratio (p = 0.7274). Statistical comparison of the eye size ratio, using data from three independent injections, was conducted using a randomised block experiment analysis in GraphPad Prism. Subsequently, mixed-effects analysis followed by Tukey’s post-test was employed to compare different experimental groups to the WT ratio. D 2D and 3D phenotyping of mab21l2-CE14 and mab21l2-non-CE crispants. mesoSPIM light-sheet microscopy in toto imaging of a mab21l2-non-CE (i) and CE14 (vii) embryo stained for PNA-Lectin (blue), WGA-Lectin (green) and Atp1a1 (red) showing coloboma in CE14 crispants (abbreviations: C = coloboma, E = eye). Multiclass U-Net for segmentation of retina (cyan) and lens (yellow) are shown (ii-v, viii-xi), together with three-dimensional U-Net reconstructions (vi, xii) revealing aberrant retinal morphology, coloboma and malformed lens in CE14 crispants (xii) (white arrows). E, F Histograms showing quantification of U-Net reconstructions of retina volume (E) and sphericity (F), revealing a significant reduction of both parameters in mab21l2-CE14 crispant eyes (n = 4) compared to non-CE crispant eyes (n = 6). Statistical significance was determined using a non-parametric two-sided Mann-Whitney U test for the retina volume (p = 0.0095) and a two-sided unpaired t test for sphericity (p = 0.0409). Panels (C, E and F): Data are presented as mean ± SD; ns: not significant, *p ≤ 0.05, **p ≤ 0.01, ***p ≤ 0.001. Source data provided in the Source Data file.
|