
Fig. 3
- ID
- ZDB-IMAGE-241028-169
- Publication
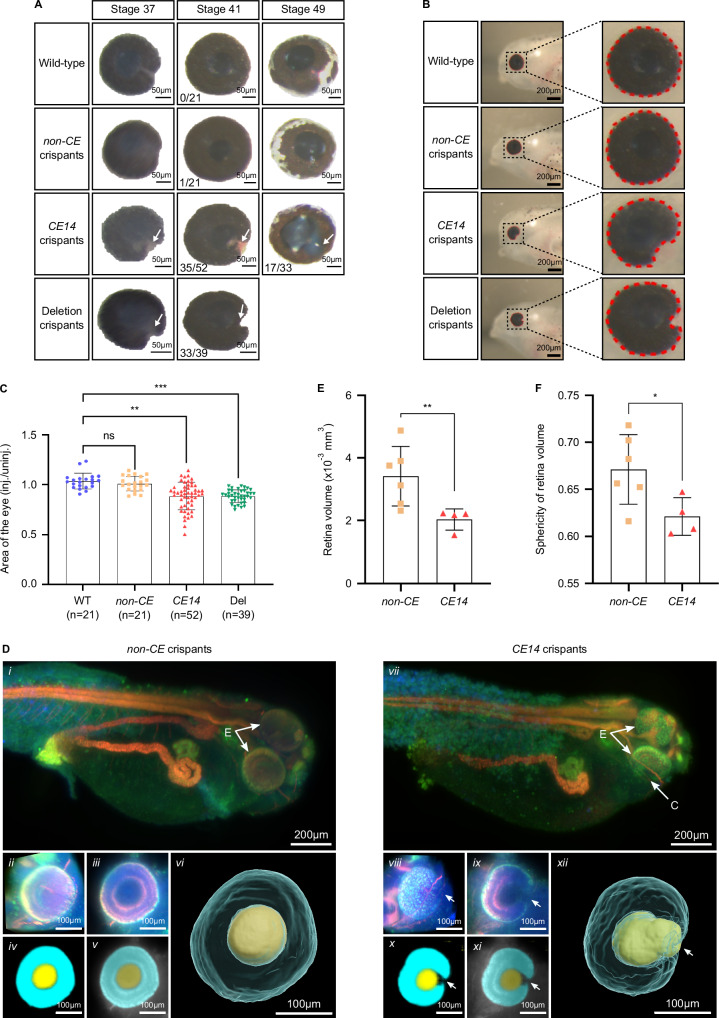
- Ceroni et al., 2024 - Deletion upstream of MAB21L2 highlights the importance of evolutionarily conserved non-coding sequences for eye development
- All Figures
- Figures for Ceroni et al., 2024
|
Fig. 3
Characterisation of eye size and morphology in