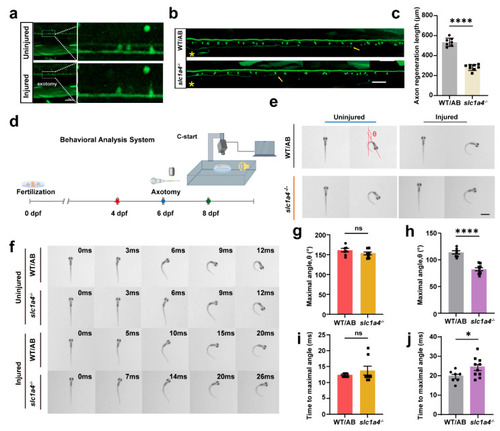
Deficiency in Slc1a4 suppresses Mauthner cell axon regeneration and relative function in vivo. (a) Representative images of confocal imaging of M-cell axon before and after ablation by two-photon laser above cloacal pore (scale bar, 50 μm). (b,c) Representative diagram of confocal imaging of M-cells’ axon regeneration between WT and slc1a4−/−. Data shown as mean ± sem. Scale bar, 50 μm. Assessed by unpaired t-test. **** p < 0.0001. Asterisk, ablation site; Arrow, regeneration endpoint location. (d) Device for testing escape behavior. (e) Representative images of original orientation and maximal turn angle position from WT and slc1a4−/− zebrafish larvae in uninjured and injured groups. Red lines indicate heading direction. (f) Series of images of movement trajectory from WT and slc1a4−/− zebrafish larvae in uninjured and injured groups. (g,h) Statistical diagram of maximal turn angle, θ. Data shown as mean ± sem. Uninjured: ns, not significant (WT/AB: 161.2 ± 11.89°, n = 7; slc1a4−/−: 152.9 ± 10.36°, n = 8); injured: **** p < 0.0001 (WT/AB: 113.9 ± 3.1°, n = 7; slc1a4−/−: 82.36 ± 2.917°, n = 10). ns, not significant. Scale bar, 1 mm. Assessed by unpaired t-test. (i,j) Statistical diagram of time to maximal turn angle. Data shown as mean ± sem. Uninjured, ns, not significant (WT/AB: 12.4 ± 0.2 ms, n = 7; slc1a4−/−: 13.75 ± 1.386 ms, n = 8); injured, * p < 0.05 (WT/AB: 19.86 ± 1.143 ms, n = 7; slc1a4−/−: 24.50 ± 1.586 ms, n = 10); ns, not significant; * p < 0.05. Assessed by unpaired t-test.
|
