
Figure 6
- ID
- ZDB-FIG-241017-98
- Publication
- Djebar et al., 2024 - Astrogliosis and neuroinflammation underlie scoliosis upon cilia dysfunction
- Other Figures
- All Figure Page
- Back to All Figure Page
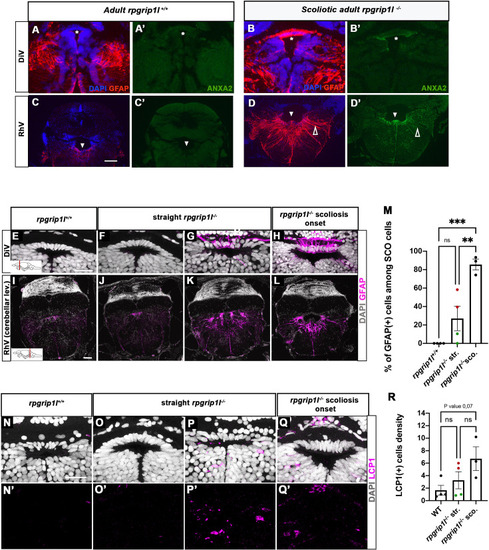
Anxa2 and GFAP upregulation and increased number of LCP1-positive cells around CNS ventricles of rpgrip1l-/- juvenile fish at scoliosis onset. (A-D’) Immunostaining for GFAP (A, B, C, D) and Anxa2 (A’, B’, C’, D’) on adult brain transverse sections at DiV (A-B’) and RhV at cerebellar level (C-D’) levels in controls (A, A’, C, C’) (n=3) and rpgrip1l-/- scoliotic (B, B’, D, D’) (n=4) fish. Nuclei are stained with DAPI (blue). White stars indicate the SCO, white triangles point to the ventral RhV region. Open arrows point to a long cellular process co-labeled by Anxa2 and GFAP. (E–L) Immunostaining for GFAP (magenta) on transverse sections of the brain at SCO (E–H) and RhV (I–L) levels in controls (E, I) (n=4), straight rpgrip1l-/- (F, G, J, K) (n=4) and scoliotic rpgrip1l-/- (H, L) (n=3) juvenile (8 wpf) fish. Nuclei are stained with DAPI (white). Scale bar: 125 µM for A-D’, 20 µm for E-H and 100 µm for I-L. (M) Graph representing the percentage of GFAP-positive cells among the total number of SCO cells in control (n=4), straight rpgrip1l-/- (n=4), and scoliotic rpgrip1l-/- (n=3) fish at scoliosis onset (N=1). Each dot represents the mean ratio of GFAP-positive over -negative cells in 3–6 sections per fish. Green dots correspond to fish with no or very low percentage of GFAP + cells, red dots to fish with a high percentage of GFAP + cells. Statistical analysis was performed with Tukey’s multiple comparisons test where ns means non-significant, ** means p-value <0.01 and *** p-value <0.001. Error bars represent s.d. ‘str’: straight; ‘sco’: scoliotic. (N-Q’) Immunostaining for LCP1 +microglia/macrophages (magenta) on brain transverse sections at SCO levels in a rectangle of 100 µm x 60 µm located under the posterior commissure in controls (n=4) (N, N’), straight rpgrip1l-/- (n=4) (O-P’) and rpgrip1l-/- at scoliosis onset (n=3) (Q, Q’) 8 wpf fish (N=1). Nuclei are stained with DAPI (white). Scale bar: 20 µm. (R) Quantification of LCP1 + cell density around the SCO in controls (n=4), straight rpgrip1l-/- (n=4) and scoliotic rpgrip1l-/- (n=3) at 8 wpf. Twenty-three sections were counted for control, 21 sections for rpgrip1l-/- straight, and 18 sections for rpgrip1l-/- scoliotic fish. Each dot represents the mean value for one fish. Green dots correspond to the fish without any GFAP +SCO cells, red dots correspond to the fish with GFAP +SCO cells (SCO cells are defined as the dorsal cells located underneath the posterior commissure and above the diencephalic ventricle). Note that straight rpgrip1l-/- fish with GFAP +SCO cells present a higher number of LCP1 + cells. Statistical analysis was performed with Tukey’s multiple comparisons test where ns means non-significant. Error bars represent s.e.m. ‘str’:straight ‘sco’: scoliotic. |