
Figure 7
- ID
- ZDB-FIG-241017-100
- Publication
- Djebar et al., 2024 - Astrogliosis and neuroinflammation underlie scoliosis upon cilia dysfunction
- Other Figures
- All Figure Page
- Back to All Figure Page
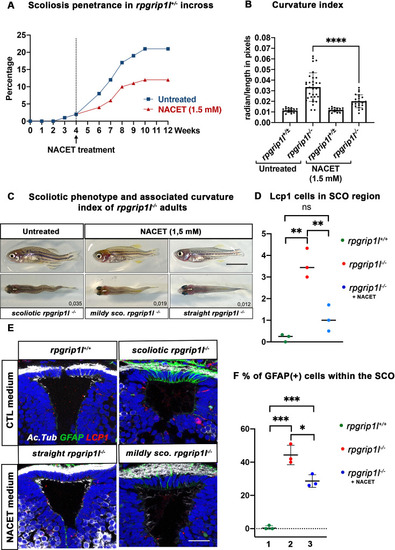
NACET treatment reduces scoliosis penetrance and severity in rpgrip1l-/- and decreases astrogliosis and LCP1 + cell number at SCO level. (A) Kinetics of scoliosis development in rpgrip1l+/- incrosses in the presence (n=150 fish) or absence (n=174 fish) of NACET treatment (1.5 mM) from 4 to 12 weeks (N=1). ‘str’: straight; ‘sco’: scoliotic. (B) Quantification of body axis curvature from dorsal and lateral views at 13 wpf, at the end of the NACET treatment. Each dot corresponds to one fish. Among the 174 fish raised in untreated condition, we measured 18 controls (rpgrip1l±/-) and 33 rpgrip1l-/-, and upon NACET treatment, 16 controls (rpgrip1l±/+) and 23 rpgrip1l-/-. rpgrip1l±/- represents a pool of rpgrip1l+/+ and rpgrip1l+/-. Statistical analysis was performed using Tukey’s multiple comparisons test where * means p-value <0.05; ** means p-value <0.01; *** means p-value <0.001; **** means p-value <0.0001. Error bars represent s.d. (C) Representative pictures of rpgrip1l-/- fish with their curvature index without or after NACET treatment, at 13 wpf. Scale bar is 0.5 cm. Left panels correspond to an untreated rpgrip1l-/- scoliotic fish on lateral (upper) and dorsal (lower) views. Middle panels represent treated rpgrip1l-/-, with a lower curvature index than scoliotic fish on lateral (upper) and dorsal (lower) views and right panels are pictures of rescued straight rpgrip1l-/- fish on lateral (upper) and dorsal (lower) views. (D) Graph representing the number of LCP1 + cells in wt (n=3), untreated rpgrip1l-/- (n=3) and NACET-treated rgprip1l-/- (n=3) fish in the SCO region (N=1). (E) Immunostaining for GFAP (green), Acetylated tubulin (white) and LCP1 (red) on adult brain transverse sections at SCO level in untreated (upper panels) and NACET-treated (lower panels) fish. Nuclei are stained with DAPI (blue). No GFAP staining was present in controls (n=3) (upper left), while untreated mutants displayed strong GFAP labeling (upper right) (n=3). NACET treatment totally suppressed gliosis in a straight rpgrip1l-/- fish (lower right panel) (n=1) and diminished the intensity of GFAP labeling in slightly tail-up rpgrip1l-/- (n=2). Scale bar: 12.5 µm. (F) Graph presenting the percentage of GFAP positive cells among the total number of SCO secretory cells compared between controls (n=3), untreated rpgrip1l-/- (n=3), and NACET treated rpgrip1l-/- adult fish (n=3) (N=1). Each dot represents the mean of % of GFAP-positive cells present in 3–6 sections per fish. |