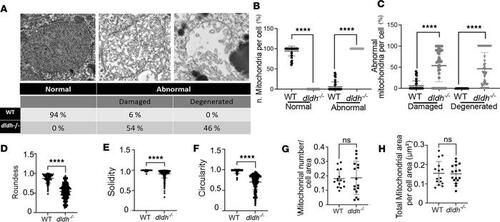
Mitochondrial ultrastructure changes in 7 dpf dldh–/– liver mitochondria. (A) “Normal” and “abnormal” (damaged and degenerated) ultrastructure representative images above summary table for analysis of 3 WT and 3 dldh–/– zebrafish from 34 (WT) and 43 (dldh–/–) cells and 209 (WT) and 635 (dldh–/–) mitochondria analyzed (the “damaged” mitochondrion is present in Figure 5I image). (B) Scatter plot showing percent of normal and abnormal mitochondria per cell, as described in A. Data are shown as mean ± SD. (C) Percent of abnormal mitochondria classified as damaged or degenerated, as described in A. (D–F) Morphological features analyzed: roundness, solidity, and circularity quantifying mitochondrial shape integrity in WT and dldh–/– larvae. (G) Mitochondria number relative to cell area (μm–2). Points indicate mitochondria number per cell. (H) Total mitochondrial area relative to cell area. (D–H) Mitochondria, n = 148 (WT) and 245 (dldh–/–); cells, n = 15 (WT) and 16 (dldh–/–). Data are shown as mean ± SD. All statistical analyses by unpaired Student’s t test. ****P < 0.0001.
|
