
Fig. 2
- ID
- ZDB-FIG-240916-81
- Publication
- Chen et al., 2024 - Temporal and Spatial Variations in Zebrafish Hairy/E(spl) Gene Expression in Response to Mib1-Mediated Notch Signaling During Neurodevelopment
- Other Figures
- All Figure Page
- Back to All Figure Page
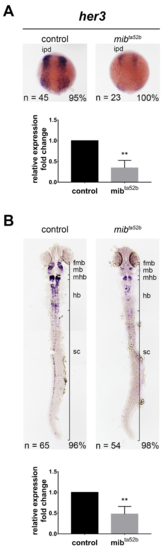
Expression of her3 in wild-type and mib1 ta52 b mutant zebrafish embryos. In situ hybridization demonstrates the expression of her3 in wild-type siblings (left panels) and mib1 ta52 b mutant embryos (right panels) at the bud stage (A) and 24 h post-fertilization (hpf) (B). Images depict dorsal views with anterior to the top. fmb, fore-midbrain boundary; hb, hindbrain; ipd, inter-proneuronal domain; mb, midbrain; mhb, mid-hindbrain boundary; scn, spinal cord neurons. The expression levels of her3 were validated using quantitative real-time polymerase chain reaction (qRT-PCR), displayed at the bottom panels. Quantitative data are presented as mean ± standard error of mean (SEM). Statistical analysis was performed by Student’s t-test. All reactions were performed in triplicate for each sample. **, p < 0.01. |