
Fig. 3
- ID
- ZDB-FIG-240916-82
- Publication
- Chen et al., 2024 - Temporal and Spatial Variations in Zebrafish Hairy/E(spl) Gene Expression in Response to Mib1-Mediated Notch Signaling During Neurodevelopment
- Other Figures
- All Figure Page
- Back to All Figure Page
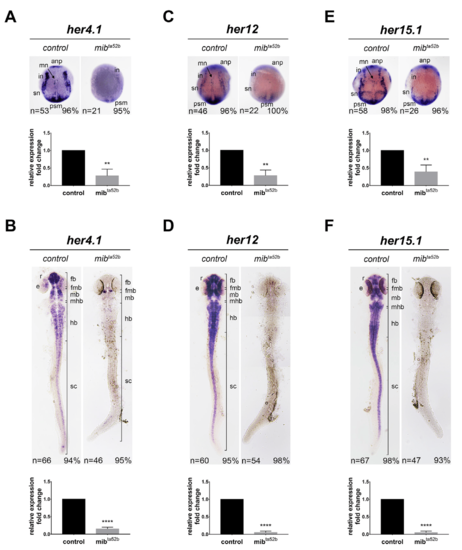
Comparison of her4.1, her12, and her15.1 expression in wild-type and mib1 ta52 b mutant embryos. The expression of her4.1 (A,B), her12 (C,D), and her15.1 (E,F) was detected in wild-type sibling embryos (left panels) and mib1 ta52 b homozygous mutant zebrafish embryos (right panels) at the bud stage (A,C,E) and 24 hpf (B,D,F) using in situ hybridization. Dorsal views with anterior toward the top. Key anatomical features include the anp, anterior neural plate; e, eye; fb, forebrain; fmb, fore-midbrain boundary; hb, hindbrain; in, interneurons; mn, motor neurons; psm, presomitic mesoderm; r, retina; sn, sensory neurons; sc, spinal cord. The expression levels were further validated using quantitative real-time polymerase chain reaction (qRT-PCR). Quantitative data are presented as mean ± standard error of mean (SEM); statistical analysis was performed by Student’s t-test. All reactions were performed in triplicate for each sample. **, p < 0.01, ****, p < 0.0001. |