
Fig. 3
- ID
- ZDB-FIG-240822-26
- Publication
- Hong et al., 2024 - A novel NIR fluorescent probe for visualizing hydrogen sulfide in Alzheimer's disease
- Other Figures
- All Figure Page
- Back to All Figure Page
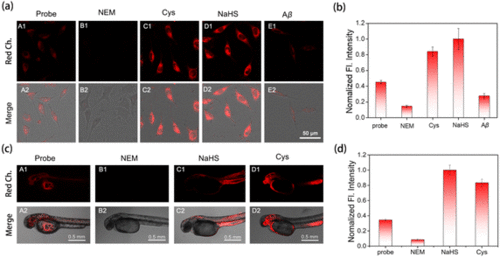
(a) Confocal fluorescence imaging of endogenous and exogenous H2S in SH-SY5Y cells. (A1 and A2) Cells were incubated with probe 1 (5 μM) for 30 min. (B1 and B2) The cells were pretreated with NEM (200 μM) for 30 min, and then incubated with probe 1 (5 μM, 30 min). (C1 and C2) The cells were pretreated with Cys (200 μM) for 30 min, and then incubated with probe 1 (5 μM, 30 min). (D1 and D2) Cells were pretreated with NEM (0.2 mM) for 30 min, subsequently incubated with NaHS (100 μM, 30 min), and finally incubated with probe 1 (5 μM) for 30 min. (E1 and E2) Cells were pretreated with Aβ42 aggregates (5 μM) for 60 min and then incubated with probe 1 (5 μM) for 30 min. (b) Relative pixel intensity in panel (a) (λex = 458 nm, λem = 600–750 nm for the red channel). Scale bar: 50 μm. (c) Confocal fluorescence imaging of endogenous and exogenous H2S in zebrafish. (A1 and A2) Zebrafish were incubated with probe 1 (10 μM) for 60 min. (B1 and B2) The cells were pretreated with NEM (200 μM) for 30 min, and then incubated with probe 1 (10 μM, 60 min). (C1 and C2) Cells were pretreated with NEM (200 μM) for 30 min, subsequently incubated with NaHS (100 μM, 30 min), and finally incubated with probe 1 (10 μM) for 60 min. (D1 and D2) The cells were pretreated with Cys (100 μM) for 30 min, and then incubated with probe 1 (10 μM, 60 min). (d) Relative pixel intensity in panel (c) (λex = 458 nm, λem = 600–750 nm for the red channel). Scale bar: 0.5 mm. Data are mean ± SEM, n = 3. |