
Fig. 6
- ID
- ZDB-FIG-240808-43
- Publication
- Martínez-López et al., 2024 - Macrophages directly kill bladder cancer cells through TNF signaling as an early response to BCG therapy
- Other Figures
- All Figure Page
- Back to All Figure Page
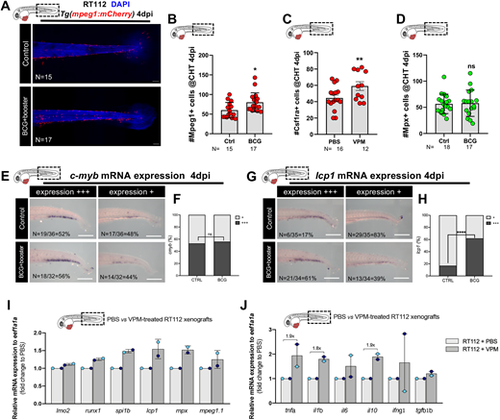
BCG induces myelopoiesis in zebrafish bladder cancer xenografts. (A) Representative confocal images of macrophages (red) in the caudal hematopoietic tissue (CHT) of NMIBC-RT112 control and BCG+booster-treated xenografts at 4 dpi. Scale bars: 50 µm. (B-D) Quantification of the absolute numbers of Mpeg1+ cells (*P=0.0155) (B), Csf1ra+ cells (**P=0.0064) (C) and Mpx+ cells (P=0.8611) (D) in the CHT of NMIBC-RT112 control and BCG+booster-treated xenografts at 4 dpi. Data are from one independent experiment. Bars indicate the results as mean±s.d. and each dot represents one xenograft. (E,F) mRNA expression of c-myb in the CHT of NMIBC-RT112 control and BCG+booster-treated xenografts at 4 dpi (E) and its corresponding quantification (F). Data were pooled from two independent experiments. (G,H) mRNA expression of lcp1 (l-plastin) in the CHT of NMIBC-RT112 control and BCG+booster-treated xenografts at 4 dpi (G) and its corresponding quantification (****P<0.001; Fisher's exact test) (H). Data are from one independent experiment. For E-H, the numbers of analyzed xenografts are indicated in the images. Scale bars: 250 µm. (I,J) Relative gene expression levels of zebrafish lmo2, runx1, spi1b, lcp1, mpx and mpeg1.1 (I) and tnfa, il1b, il6, il10, ifng1 and tgfb1b (J) at 4 dpi in the CHT of NMIBC-RT112 control and VPM1002+booster-treated xenografts. Bars indicate the fold change of expression to that in the control relative to housekeeping gene expression (mean±s.d.). Each dot represents the average of two or three technical replicates of one independent experiment. Data sets with a Gaussian distribution (B-D) were analyzed by parametric unpaired two-tailed t-test. Unless stated otherwise, each experimental data set was challenged to the respective control. ns, not significant, P≥0.05. In all images, anterior is to the left, posterior to the right, dorsal up and ventral down. Note that several transgenic backgrounds were used (see Table S1). |