
Fig. 1
- ID
- ZDB-FIG-240808-38
- Publication
- Martínez-López et al., 2024 - Macrophages directly kill bladder cancer cells through TNF signaling as an early response to BCG therapy
- Other Figures
- All Figure Page
- Back to All Figure Page
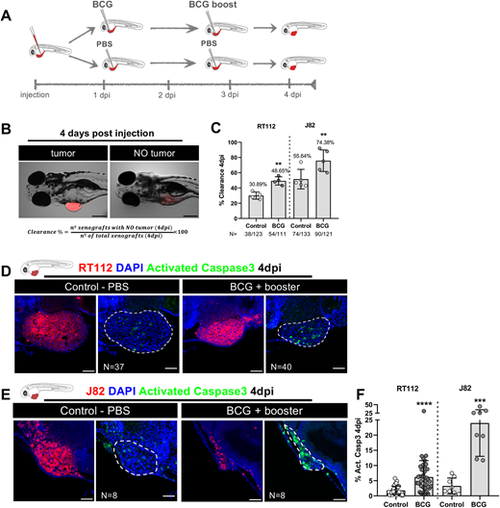
Zebrafish bladder cancer xenografts are susceptible to BCG immunotherapy. (A) Schematic representation of the BCG treatment protocol. (B) Representative brightfield images of xenografts with and without tumors at 4 days post injection (dpi). Human cancer cells were labelled with the Vybrant CM-DiI lipophilic stain (red) and the equation used for the calculation of clearance rate is shown. Scale bar: 250 µm. (C) Quantification of the percentage of clearance in NMIBC-RT112 and MIBC-J82 xenografts at 4 dpi. Bars indicate the results as mean±s.d. and each dot represents a full round of injections. N represents the number of xenografts without tumors at 4 dpi relative to the total number of xenografts at 4 dpi (**P<0.01; Fisher's exact test). (D,E) Representative confocal images of NMIBC-RT112 (D) and MIBC-J82 (E) control and BCG+booster-treated xenografts at 4 dpi. Human cancer cells were labelled with the Vybrant CM-DiI lipophilic stain (red), the apoptosis marker activated caspase-3 is in green and nuclei (DAPI counterstaining) in blue. White dashed regions outline the tumor. BCG were labelled with either the Deep Red Cell Tracker or the Vybrant CM-DiI lipophilic stains (not shown). In all images, anterior is to the left, posterior to the right, dorsal up and ventral down. Scale bars: 50 µm. (F) Quantification of the percentage of activated caspase-3-positive (apoptotic) cells to the total number of cells at 4 dpi. Bars indicate the results as mean±s.d. and each dot represents one xenograft pooled from two independent experiments. The numbers of analyzed xenografts are indicated in D,E. ***P<0.001; ****P<0.0001 (parametric unpaired two-tailed t-test). Note that the experiments presented in this figure and in Fig. S4 were performed in parallel; thus, they share the same set of controls and BCG+booster samples, and several transgenic backgrounds were used (see Table S1). |