
Fig. 2
- ID
- ZDB-FIG-240808-39
- Publication
- Martínez-López et al., 2024 - Macrophages directly kill bladder cancer cells through TNF signaling as an early response to BCG therapy
- Other Figures
- All Figure Page
- Back to All Figure Page
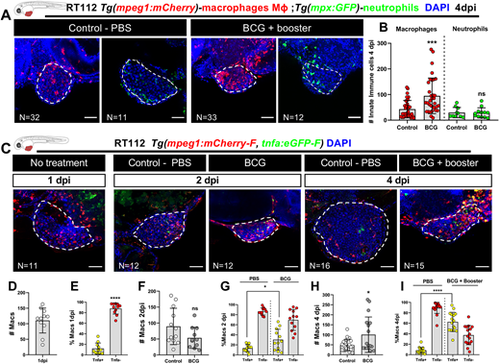
BCG modulates recruitment and polarization of macrophages in zebrafish bladder cancer xenografts. (A) Representative confocal images of macrophages (red) and neutrophils (green) in NMIBC-RT112 control and BCG+booster-treated xenografts, in which human cancer cells were labelled with the Deep Red Cell Tracker lipophilic stain (not shown). (B) Quantification of the absolute numbers of infiltrating macrophages and neutrophils at 4 dpi (***P=0.0003). (C) Representative confocal images of Tnfa expression (green) and macrophages (red) in NMIBC-RT112 control and BCG+booster-treated xenografts, in which human cancer cells were labelled with the Deep Red Cell Tracker lipophilic stain (not shown). In A,C, white dashed regions outline the tumor. BCG were labelled with either the Deep Red Cell Tracker or the Vybrant CM-DiI lipophilic stain (not shown). In all images, anterior is to the left, posterior to the right, dorsal up and ventral down. Scale bars: 50 µm. (D-I) Quantification of the absolute numbers of macrophages and the percentage of Tnfa-positive and Tnfa-negative macrophages in the tumor microenvironment at 1 dpi before treatment (****P<0.0001) (D,E), in control and BCG-treated xenografts at 2 dpi (ns, not significant, P≥0.05; *P=0.0190) (F,G), and in control and BCG+booster-treated xenografts at 4 dpi (*P<0.05; ****P<0.0001) (H,I). Bars in B,D-I indicate the results as mean±s.d. and each dot represents one xenograft pooled from two independent experiments. The numbers of analyzed xenografts are indicated in A,C. Data sets with a Gaussian distribution (B,D-I) were analyzed by parametric unpaired two-tailed t-test. Note that the quantitative data presented in B are also shown in Fig. 3C as these data concern the same sets of experiments and xenografts. These experiments were performed in parallel with those in Fig. 3; thus, they share the same controls, and several transgenic backgrounds were used (see Table S1). |