
FIGURE
Fig. 2
Fig. 2
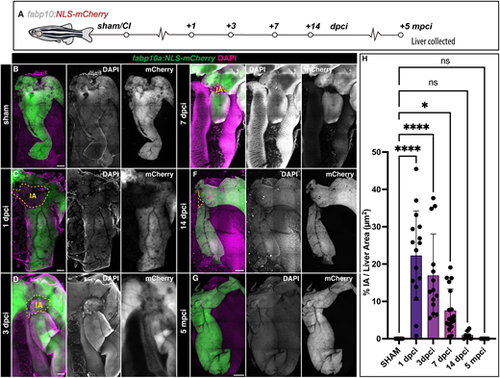
Progression of liver regeneration after cryoinjury. (A) A simplified schematic illustrating the collection of livers timeline after cryoinjury. (B-G) Whole-mount images of cleared zebrafish livers at the indicated stages of regeneration. Yellow dashed lines indicate the border zone. (H) Quantification of the IA area compared with the visible liver parenchyma area (n=16, 16, 14, 18, 7 and 12, left to right). Data are mean±s.d. P-values were calculated using one-way ANOVA followed by Tukey's multiple comparisons test (*P<0.05, ****P<0.0001). Scale bars: 500 µm. |
Expression Data
| Gene: | |
|---|---|
| Fish: | |
| Condition: | |
| Anatomical Term: | |
| Stage: | Adult |
Expression Detail
Antibody Labeling
Phenotype Data
| Fish: | |
|---|---|
| Condition: | |
| Observed In: | |
| Stage: | Adult |
Phenotype Detail
Acknowledgments
This image is the copyrighted work of the attributed author or publisher, and
ZFIN has permission only to display this image to its users.
Additional permissions should be obtained from the applicable author or publisher of the image.
Full text @ Development