
Fig. 4
- ID
- ZDB-FIG-240731-4
- Publication
- Xie et al., 2024 - Zebrafish myo7aa affects congenital hearing by regulating Rho-GTPase signaling
- Other Figures
- All Figure Page
- Back to All Figure Page
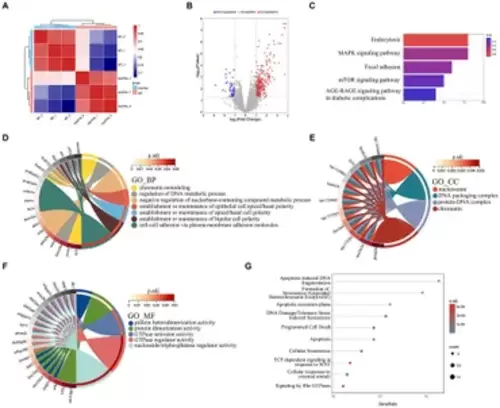
The results of RNA-seq analysis, (A) the Principal Component Analysis (PCA) diagram; (B) the volcano plot of differentially expressed genes. Red dots indicate upregulated genes. Blue dots indicate genes that are down-regulated; (C) the enrichment bar chart of gene function annotation analysis in the KEGG database. The bar length in the chart represents the number of genes. The bar color represents the p corrected value; (D–F) the GO database enrichment analysis results are provided for Biological process (BP), cellular component (CC), and molecular function (MF); (G) the Reactome database enrichment analysis results. |