
Fig. 6
- ID
- ZDB-FIG-240725-34
- Publication
- Li et al., 2024 - Biosynthetic deficiency of docosahexaenoic acid causes nonalcoholic fatty liver disease and ferroptosis-mediated hepatocyte injury
- Other Figures
- All Figure Page
- Back to All Figure Page
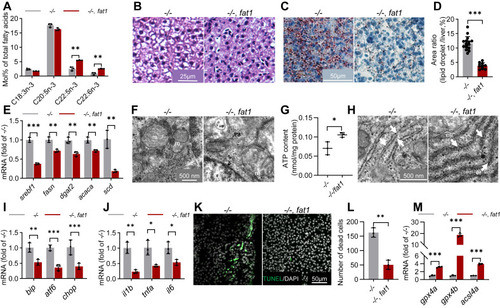
NAFLD in elovl2 mutant were rescued by fat1-transgenesis. A, fatty acid composition in −/− and −/−, fat1 livers. B, HE (hematoxylin-eosin) staining of −/− and −/−, fat1 liver sections. Scale bar: 25 μm. C and D, Oil-Red staining of −/− and −/−, fat1 liver sections, and quantitative analysis of Oil-Red staining signals. Scale bar: 50 μm. E, qRT-PCR analysis of genes involved in lipogenesis in −/− and −/−, fat1 livers. N = 3 replicates. F, analysis of mitochondria ultrastructure in the hepatocytes of −/− and −/−, fat1 liver sections. m: mitochondria. Scale bar: 500 nm. G, analysis of ATP production in −/− and −/−, fat1 livers. H, analysis of ER (endoplasmic reticulum) ultrastructure in the hepatocytes of −/− and −/−, fat1 liver sections. er: white arrow indicated. scale bar: 500 nm. I, qRT-PCR analysis of genes involved in ER stress in −/− and −/−, fat1 livers. N = 3 replicates. J, qRT-PCR analysis of genes involved in inflammation in the liver of −/− and −/−, fat1 livers. N = 3 replicates. K and L, TUNEL (TdT-mediated dUTP Nick-End Labeling) assays in −/− and −/−, fat1 liver sections. Scale bar: 50 μm. M, qRT-PCR analysis of gpx4a, gpx4b, acsl4a, acsl4b in the liver of −/− and −/−, fat1 livers. N = 3 replicates. All values are mean ± SD. A Student t test was used. ∗p < 0.05, ∗∗p < 0.01, ∗∗∗p < 0.001. Individual p values are listed in Table S8 . −/−, elovl2−/−; fat1, elovl2−/−/fat1. |