
Fig. 6
- ID
- ZDB-FIG-240711-6
- Publication
- Gentile et al., 2024 - Mechanical forces remodel the cardiac extracellular matrix during zebrafish development
- Other Figures
- All Figure Page
- Back to All Figure Page
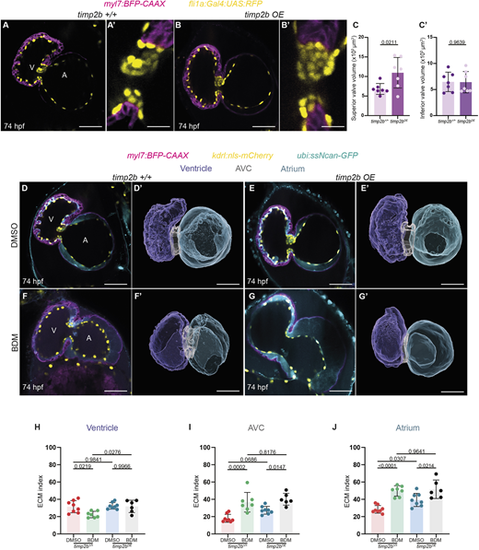
timp2 overexpression leads to enlarged cardiac valves and increased AVC and atrial ECM index. (A-B′) Single-plane images and close-up of AV valves of 74 hpf control (A,A′) and timp2b-overexpressing [Tg(fli1a:Gal4); Tg(UAS:timp2b-p2a-GFP); B,B′] hearts. There is noticeable enlargement of the valve observed in timp2b-overexpressing hearts (B′) compared with control (A′). (C,C′) Quantification of 3D valve tissue volumes in control and timp2b-overexpressing larvae at 74 hpf. When timp2b is overexpressed in EdCs, a significantly increased valve tissue volume is observed in the superior leaflet, but not in the inferior leaflet. (D-G′) Single-plane images and 3D surface renderings of 74 hpf control (D,D′,F,F′) and timp2b-overexpressing (E,E′,G,G′) hearts treated with DMSO (D-E′) or BDM (F-G′) starting at 50 hpf. Upon BDM treatment, timp2b overexpression leads to severe cardiac defects (G,G′) that appear worse than those in BDM-treated control larvae (F,F′). (H-J) Quantification of cECM index of 74 hpf control and timp2b-overexpressing hearts treated with DMSO or BDM starting at 50 hpf. Increased AVC (I) and atrial (J) cECM index is observed in timp2b-overexpressing hearts treated with DMSO. n=7 for timp2b+/+ and 7 for timp2bOE (C,C′); 8 for DMSO, timp2b+/+; 7 for BDM, timp2b+/+; 8 for DMSO, timp2bOE; and 6 for BDM, timp2bOE. Plot values represent mean±s.d.; P-values determined by unpaired two tailed Student's t-test (C,C′) or one-way ANOVA followed by multiple comparisons with Dunn test (H-J). Scale bars: 20 µm (A,B); 10 µm (A′,B′); 30 µm (D-G′). A, atrium; AVC, atrioventricular canal; V, ventricle. |