
Fig. 4
- ID
- ZDB-FIG-240711-4
- Publication
- Gentile et al., 2024 - Mechanical forces remodel the cardiac extracellular matrix during zebrafish development
- Other Figures
- All Figure Page
- Back to All Figure Page
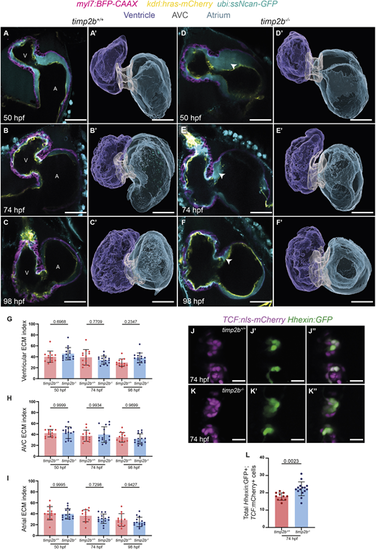
timp2b mutant hearts exhibit increased cECM thickness in the atrial side of the AVC. (A-F′) Single-plane images and 3D surface renderings of timp2b+/+ (A-C′) and timp2b−/− (D-F′) sibling hearts at 50, 74 and 98 hpf. cECM thickness is increased in the atrial side of the AVC (white arrowheads in D-F) in timp2b−/− hearts compared with timp2b+/+ sibling hearts. (G-I) Quantification of the ventricular, AVC and atrial ECM indices at 50, 74 and 98 hpf. (J-K″) Single-plane images of AV valves from 74 hpf timp2b−/− and timp2b+/+ sibling larvae. Valve EdCs are labeled by Tg(TCF:nls-mCherry) and Tg(Hhexin:GFP) expression. (L) Quantification of the total number of Tg(Hhexin:GFP)+; Tg(TCF:nls-mCherry)+ cells at 74 hpf shows an increased number of valve cells in timp2b−/− compared with timp2b+/+ sibling larvae. n=13 for timp2b+/+ and 15 for timp2b−/− (G-I); n=11 for timp2b+/+ and 15 for timp2b−/− (L). Plot values represent mean±s.d.; P-values determined by one-way ANOVA followed by multiple comparisons with Dunn test (G-I) and by unpaired two-tailed Student's t-test (L). Scale bars: 30 µm (A-F′); 20 µm (J-K″). A, atrium; AVC, atrioventricular canal; V, ventricle |