
Fig. 1
- ID
- ZDB-FIG-240711-1
- Publication
- Gentile et al., 2024 - Mechanical forces remodel the cardiac extracellular matrix during zebrafish development
- Other Figures
- All Figure Page
- Back to All Figure Page
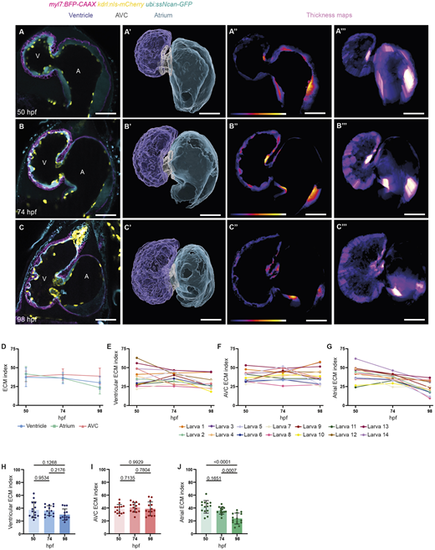
cECM remodeling during cardiac morphogenesis. (A-C‴) cECM dynamics in the same animal from 50 to 98 hpf. Single-plane images (A-C) and 3D surface renderings (A′-C′) of confocal images, as well as single-plane (A″-C″) and maximum intensity projection (A‴-C‴) thickness maps of wild-type hearts at 50, 74 and 98 hpf. Color brightness in the thickness maps (A″-C‴) correlates with tissue/ECM thickness. White indicates higher tissue/ECM thickness, and purple indicates lower tissue/ECM thickness. Tg(myl7:BFP-CAAX) expression marks the myocardial chambers, Tg(kdrl:nls-mCherry) expression marks the endocardial chambers, and Tg(ubb:ssNcan-GFP) expression labels hyaluronic acid, which is present in the cardiac ECM. (D-J) Quantification of the cECM index (percentage of the ECM volume relative to the total cardiac tissue volume) in the ventricle (D,E,H), the AVC (D,F,I) and the atrium (D,G,J) from 50 to 98 hpf. Between 50 and 98 hpf, the cECM index remains constant in the ventricle and AVC and progressively decreases in the atrium. n=14 (D-J); plot values represent mean±s.d. (D,H-J); P-values determined by one-way ANOVA followed by multiple comparisons with Dunn test (H-J). Scale bars: 30 µm. A, atrium; AVC, atrioventricular canal; V, ventricle. |