
Fig. 7
- ID
- ZDB-FIG-240703-81
- Publication
- Luo et al., 2024 - Targeting TNF/IL-17/MAPK pathway in hE2A-PBX1 leukemia: effects of OUL35, KJ-Pyr-9, and CID44216842
- Other Figures
- All Figure Page
- Back to All Figure Page
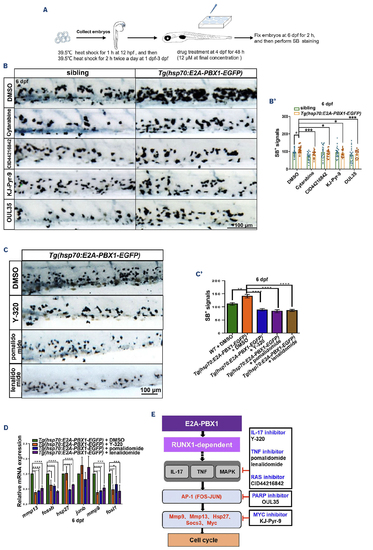
KJ-Pyr-9, OUL35, and CID44216842 effectively alleviate hE2A-PBX1-induced myeloid expansion in zebrafish larvae. (A) Flowchart illustrating the high-throughput drug screening process conducted in this study. Briefly, embryos were collected and subjected to a 1-hour heat shock at 12 hours post-fertilization (hpf), followed by twice daily 2-hour heat shocks from 1 to 3 days post-fertilization (dpf). Subsequently, zebrafish larvae were soaked in a solution containing small molecule compounds (initial screening concentration was 12 μM), the number of neutrophils was quantified using Sudan Black B (SB) staining at 6 dpf. (B) SB staining of sibling (left panel) and Tg(hsp70:E2A-PBX1-EGFP) (right panel) larvae after treatment with dimethyl sulfoxide (DMSO), 6.17 mM Ara-C (cytarabine), 8 μM KJ-Pyr-9, 20 μM CID44216842 and 24 μM of OUL35 at 6 dpf. (B’) Statistical analysis of the SB+ signals shown in panel (B). The black asterisks indicate statistical difference (N≥18, one-way ANOVA, mean ± standard error of the mean [SEM]; *P<0.05, ***P<0.001). (C) SB staining of hE2A-PBX1 zebrafish larvae after inhibitors treatment (DMSO, 500 µM pomalidomide, 500 μM lenalidomide, and 0.75 μM Y-320 inhibitor, respectively). The caudal hematopoietic tissue (CHT) is enlarged in the red box (original magnification ×200). (C’) Statistical analysis of the SB+ signals in panel (C). The black asterisks indicate statistical difference (N≥18, one-way ANOVA, mean ± SEM; **P<0.01, ****P<0.0001). (D) Real time quantitative polymerase chain reaction (RT-qPCR) analysis showing mRNA expression of mmp13, fosab, hsp27, junb, mmp9, and fosl1a in Tg(hsp70:E2A-PBX1-EGFP) compared to siblings after inhibitor treatment (one-way ANOVA, mean ± SEM; *P<0.05, ***P<0.001, ****P<0.0001). (E) Schematic representation of inhibitors targeting TNF/IL-17/MAPK signaling pathway. TNF: tumor necrosis factor; IL-17: interleukin-17; MAPK: mitogen-activated protein kinase. The AP-1 (activator protein 1) transcription factor is a dimeric complex that contains members of the JUN, FOS, ATF and MAF protein families. |