
Fig. 1
- ID
- ZDB-FIG-240703-75
- Publication
- Luo et al., 2024 - Targeting TNF/IL-17/MAPK pathway in hE2A-PBX1 leukemia: effects of OUL35, KJ-Pyr-9, and CID44216842
- Other Figures
- All Figure Page
- Back to All Figure Page
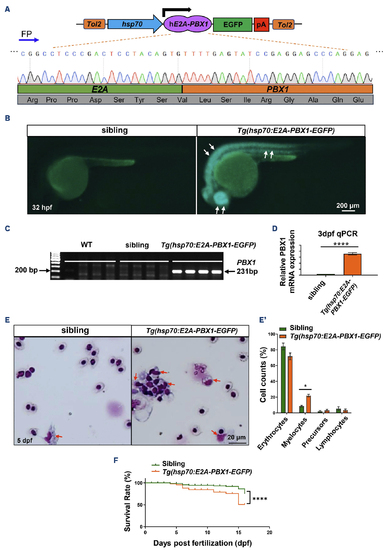
Generation and characterization of transgenic zebrafish expressing human E2A-PBX1 (hE2A-PBX1). (A) Schematic representation of Tg(hsp70:E2A-PBX1-EGFP) expression vector, and Sanger sequencing confirmed the presence of the hE2A-PBX1 sequence. FP: forward primer; pA: poly A termination sequence. (B) F4 generation hE2A-PBX1-transgenic embryos exhibited EGFP expression at 32 hours post-fertilization (hpf). EGFP- (sibling) and EGFP+ (Tg(hsp70:E2A-PBX1-EGFP)) embryos obtained by crossing the stable line Tg(hsp70:E2A-PBX1-EGFP) with wild-type (WT) fish. Tg(hsp70:E2A-PBX1-EGFP) embryos exhibited strong EGFP fluorescence (white arrows). (C) Specific polymerase chain reaction (PCR) amplification of a 231 bp fragment within the hE2A-PBX1 fusion region confirmed the integration of hE2A-PBX1 cDNA sequence into the genomes of Tg(hsp70:E2A-PBX1-EGFP). (D) Real time quantitative PCR (RT-qPCR) analysis showed hE2A-PBX1 mRNA high expression in Tg(hsp70:E2A-PBX1-EGFP) compared to the siblings at 3 days post-fertilization (dpf). The black asterisks indicate statistical difference (Student t tests, mean ± standard error of the mean; ****P<0.0001) (E) Wright-Giemsa staining of whole blood cells from siblings and Tg(hsp70:E2A-PBX1-EGFP) at 5 dpf. Myelocytes are indicated by red arrows in the image. (E’) Statistical analysis of the cell counts in panel (E). The black asterisks indicate statistical difference (one-way ANOVA, mean ± standard error of the mean; *P<0.05). N>150, number of zebrafish larvae. (F) Survival curves of Tg(hsp70:E2A-PBX1-EGFP) and sibling larvae up to 15 days after heat shock. The black asterisks indicate statistical difference (log-rank [Mantel-Cox] test; ****P<0.0001). |