
Fig. 2
- ID
- ZDB-FIG-240703-76
- Publication
- Luo et al., 2024 - Targeting TNF/IL-17/MAPK pathway in hE2A-PBX1 leukemia: effects of OUL35, KJ-Pyr-9, and CID44216842
- Other Figures
- All Figure Page
- Back to All Figure Page
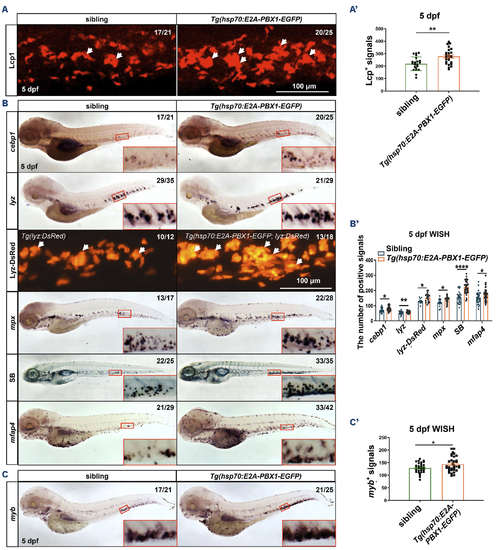
Induction of hE2A-PBX1 expression in zebrafish larvae leads to myeloid cell and hematopoietic stem cell expansion. (A) Immunofluorescence staining of Lcp1+ cells in siblings (left panel) and Tg(hsp70:E2A-PBX1-EGFP) (right panel) at 5 days post-fertilization (dpf). (A’) Statistical analysis of the Lcp1+ signals in panel (A). The black asterisks indicate statistical difference (Student t tests, mean ± standard error of the mean [SEM]; **P<0.01) (B) Whole mount in situ hybridization (WISH) of cebp1, lyz, mpx and mfap4 expressions in Tg(hsp70:E2A-PBX1-EGFP) (right panel) were higher than siblings (left panel) at 5 dpf. The number of lyzDsRed+ cells (caudal hematopoietic tissue [CHT] region and Sudan Black B-positive [SB+] cells in Tg(hsp70:E2A-PBX1-EGFP) (right) was higher than siblings (left) at 5 dpf. The CHT is enlarged in the red box (original magnification ×200). (B’) Statistical analysis of the positive signals (cebp1, lyz, lyz-DsRed, mpx, SB and mfap4) in panel (B). The black asterisks indicate statistical difference (Student t tests, mean ± SEM; *P<0.05, **P<0.01, ****P<0.0001) (C) WISH of myb expressions in Tg(hsp70:E2A-PBX1-EGFP) (right panel) were higher than siblings (left panel) at 5 dpf. (C’) Statistical analysis of the myb+ signals in panel (C). The black asterisks indicate statistical difference (Student t tests, mean ± SEM; *P<0.05). N/N: number of zebrafish larvae showing representative phenotype/total number of zebrafish larvae examined. |