
Fig. 3
- ID
- ZDB-FIG-240702-188
- Publication
- Sommer et al., 2019 - Monitoring Tuberculosis Drug Activity in Live Animals by Near-Infrared Fluorescence Imaging
- Other Figures
- All Figure Page
- Back to All Figure Page
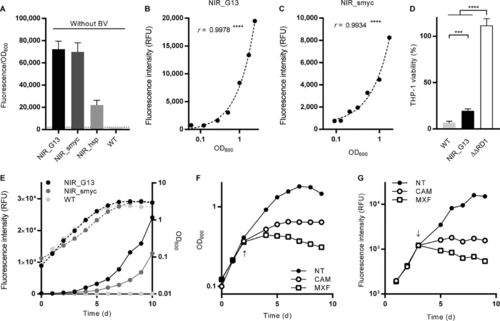
Characterization of NIR fluorescent reporters in M. tuberculosis. (A) Higher fluorescence intensities can be achieved when iRFP and ho1 are expressed from the G13 or Psmyc promoter. The dotted line indicates the background fluorescence of WT bacteria under the same measurement conditions. (B, C) The NIR fluorescence measured over 1 week of growth in liquid culture correlates with the OD600 for the M. tuberculosis NIR_G13 (B) and NIR_smyc (C) strains. r is the Pearson correlation coefficient. ****, P < 0.0001. (D) Viability of THP-1 cells upon infection with M. tuberculosis NIR_G13, the parental (WT) strain, and the attenuated ΔΔRD1 strain. ***, P < 0.001; ****, P < 0.0001. (E) Comparison of the growth curves (broken line) and evolution of the fluorescence intensity (solid lines) in liquid cultures for the NIR_G13, NIR_smyc, and parental (WT) strains. (F) Measurements of the cell density in M. tuberculosis NIR_G13 liquid cultures exposed to chloramphenicol (CAM), moxifloxacin (MXF), or no treatment (NT). (G) Measurements of NIR fluorescence in M. tuberculosis NIR_G13 liquid cultures exposed to the indicated antibiotics or no treatment. The time of addition of antibiotics is indicated by an arrow. d, day. |