
Fig. 2
- ID
- ZDB-FIG-240702-187
- Publication
- Sommer et al., 2019 - Monitoring Tuberculosis Drug Activity in Live Animals by Near-Infrared Fluorescence Imaging
- Other Figures
- All Figure Page
- Back to All Figure Page
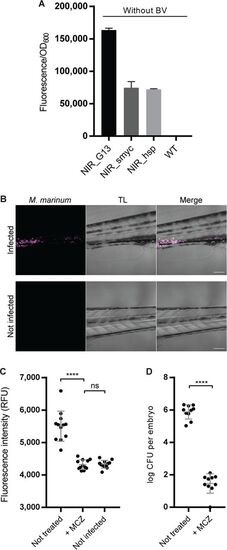
NIR fluorescent M. marinum can be visualized and quantified in infected zebrafish embryos. (A) Measurement of NIR fluorescence in cultures of M. marinum transformed with the indicated reporter constructs; data are for 3 independent transformants per measurement. The bars show the averages ± SEM. (B) Single-plane confocal micrographs showing NIR fluorescent M. marinum in zebrafish embryos at 3 dpi. Bacteria are visualized in NIR fluorescence (left), a gray picture (middle) is taken with transillumination (TL), and merged channels are shown at the right. The bottom panels are for an uninfected larva, highlighting the specific fluorescence emitted by the bacteria (displayed in magenta). Bars, 100 μm. (C) NIR fluorescence measurement of live infected zebrafish embryos with or without MCZ treatment. RFU, relative fluorescence units. (D) The numbers of CFU recovered from infected embryos with or without MCZ treatment. Each dot corresponds to one embryo, and data are for 12 (C) or 10 (D) elements per group. Bars show averages and standard deviations. ****, P < 0.0001; ns, not significant. |