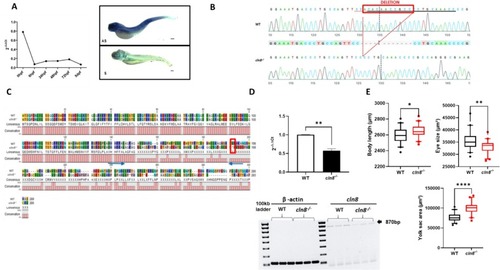
Generation of cln8−/− mutants. (A) Temporal and spatial expression of cln8 mRNA during zebrafish development evaluated using qRT-PCR and in situ hybridization at 5 dpf, the upper image indicates the antisense probe (AS), the figure below is the sense probe (S). (B) Sequence alignment of WT and mutant cln8−/− embryos shows the generation of cln8−/− mutant zebrafish by deletion of 11 bp of the cln8 gene. (C) Protein alignment of WT and mutant cln8−/−. The red rectangle shows the premature stop codon at residue 191 (p.Ala151Glufs*191), while the blue arrows indicate the forward and reverse primers used for qRT-PCR. (D) qRT-PCR analysis revealed a decrease in cln8 mRNA expression, normalized to β-actin. The image represents the RT-PCR of of the entire cln8 coding sequence, showing the decreased expression in mutants. Three independent RNA samples (each obtained from about 30–40 larvae) from cln8−/− larvae at 120 hpf and from controls were analyzed. The values are expressed as mean ± standard deviation (SD). **p ≤ 0.05, calculated by Student's t-test. (E) Morphology analysis of 5 dpf cln8−/− and WT embryos shows a slight increase in body length, a decreased eye size and an increased yolk sac area in the mutant larvae (n = 40). Data are represented as box and whisker plot with 5–95% confidence interval. All data were obtained from three independent experiments and were analyzed through statistical analysis (***p ≤ 0.001; *p ≤ 0.05) performed using the Mann-Whitney test.
|
