
Figure 5
- ID
- ZDB-FIG-240614-74
- Publication
- Abu Nahia et al., 2024 - scRNA-seq reveals the diversity of the developing cardiac cell lineage and molecular players in heart rhythm regulation
- Other Figures
- All Figure Page
- Back to All Figure Page
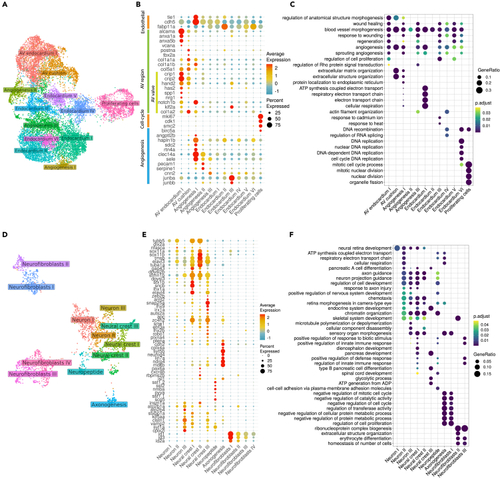
Molecular profiles of diverse endothelial and neural cell subclusters UMAP projection of endothelial (A) and neural (D) subclusters. Dotplot showing the expression of specific marker gene signatures associated with various endothelial (B) or neural (E) cell subclusters. Average expression values represent SCT normalized counts, percent expressed values represent the proportion of cells within a cluster that expresses a particular gene. Gene Ontology enrichment analysis of each endothelial (C) and neural (F) subclusters depicting the enriched functional terms (GO level 5) in each cluster. Adjusted |