
FIGURE
Figure 2
- ID
- ZDB-FIG-240614-65
- Publication
- Abu Nahia et al., 2024 - scRNA-seq reveals the diversity of the developing cardiac cell lineage and molecular players in heart rhythm regulation
- Other Figures
- All Figure Page
- Back to All Figure Page
Figure 2
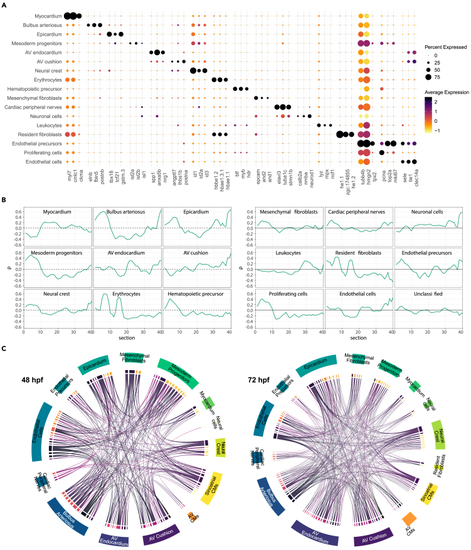
The expression profiles of main cardiac cell clusters correlate with heart structures of known spatial localization (A) Dotplot showing the top three differentially expressed genes for all cell clusters except “Unclassified”. (B) Spatial projection of cardiac single cell expression profiles to zebrafish heart sections derived from Burkhard et al. (C) Interaction map between cell clusters according to ligand-receptor expression. Each line connect individual ligand with its corresponding receptor (source data: |
Expression Data
Expression Detail
Antibody Labeling
Phenotype Data
Phenotype Detail
Acknowledgments
This image is the copyrighted work of the attributed author or publisher, and
ZFIN has permission only to display this image to its users.
Additional permissions should be obtained from the applicable author or publisher of the image.
Full text @ iScience