FIGURE

Fig. 3.

ID
ZDB-FIG-240610-17
Publication
Gur et al., 2024 - The physical and cellular mechanism of structural color change in zebrafish
Other Figures
All Figure Page
Back to All Figure Page
Fig. 3.

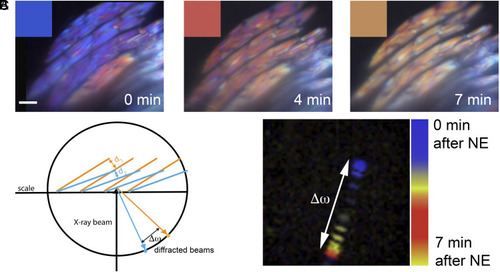
Color change in scale iridophores is driven by the tilting of crystals. (A) Iridophores are typically blue before NE treatment (Left), red 4 min after NE addition (Middle), and finally yellow 7 min after NE addition (Right) (these two shifts were seen in 6 out of 10 scales from three different fish). Insets show representative colors for each time point. (B) A schematic showing the X-ray diffraction experimental setup, where a change in the tilt orientation of crystals results in a change in the (Δω) of the diffraction spot. (C) Pseudotemporal colored representation of 32 diffraction spots over a 7-min period following NE addition. (Scale bar, (A) 10 µm.)

Expression Data

Expression Detail
Antibody Labeling
Phenotype Data

Phenotype Detail
Acknowledgments
This image is the copyrighted work of the attributed author or publisher, and ZFIN has permission only to display this image to its users. Additional permissions should be obtained from the applicable author or publisher of the image. Full text @ Proc. Natl. Acad. Sci. USA