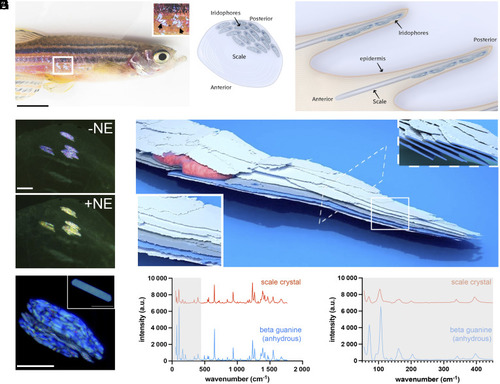
Anatomy, crystal properties, and color change capabilities of the zebrafish scale iridophores. (A) The flank of an adult zebrafish. The Top Inset shows a closeup of the reflectance of individual scale iridophores (marked with black arrows). (B and C) Schematic illustration of a zebrafish scale and tissue showing a Top view of an isolated scale in which iridophores are located adjacent to the scale on its posterior side (B), and a side view (cross-section) showing the scales within the fish dermis in which iridophores are located adjacent to the scales (C). (D) Scale iridophores before (Top) and after (Bottom) NE-treatment display violet-blue and yellow reflectance, respectively. (E) 3D rendering of FIB-SEM serial-sectioning of a scale iridophore showing an array of thin intracellular crystals arranged in parallel (highlighted by pseudocoloring in blue and gray; the cell’s nucleus is pseudocolored red). The Bottom Left Inset shows a higher magnification view of the parallel crystal arrays, while the Top Right Inset shows a perpendicular view of the crystal arrays. (F) Detected reflectance (blue) under the light microscope from scale iridophores. The Top Inset shows a single crystal isolated from a scale iridophore (G) In situ micro-Raman spectra obtained from scale iridophores (red spectrum), together with a reference spectrum for anhydrous β guanine (blue spectrum). (H) The low-wavenumber region of the samples examined in (G). (Scale bars, (A) 3 mm, (D) 80 µm, (F) 40 µm.)
|
