
Fig. 4
- ID
- ZDB-FIG-240607-4
- Publication
- Ratanayotha et al., 2024 - Insight into the function of voltage-sensing phosphatase (VSP) in hind-gut derived pseudoplacenta of a viviparous teleost Xenotoca eiseni
- Other Figures
- All Figure Page
- Back to All Figure Page
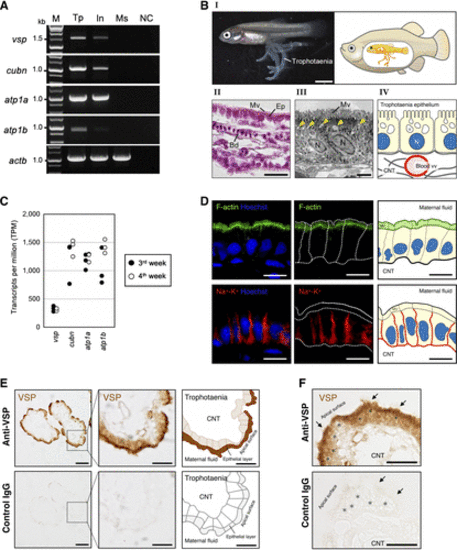
Voltage-sensing phosphatase (VSP) expression in Xenotoca eiseni trophotaenia. A: reverse transcription (RT)-PCR analysis of the VSP encoding gene (vsp) and additional target genes in selected tissues of X. eiseni. All amplicons were detected as a single band with the expected size, as determined by transcript sequences obtained from the de novo assembly. vsp, voltage-sensing phosphatase (VSP); cubn, cubilin; atp1a, Na+-K+-ATPase subunit α; atp1b, Na+-K+-ATPase subunit β; actb, actin β; M, marker; Tp, trophotaenia; In, adult intestine; Ms, adult muscle; NC, negative control (no DNA). B, I: morphological observation of trophotaenia in the intraovarian embryo of X. eiseni at 4 wk postfertilization (left). The embryo develops in the ovarian lumen of the mother fish (right). Trophotaenia is a continuous structure connected to the intestinal tract, functioning as an absorptive organ for maternal nutrients secreted into the ovarian lumen. Scale bar = 2 mm. B, II: sectional image of trophotaenia tissue stained with hematoxylin and eosin (H&E). Trophotaenia is surrounded by a monolayer of epithelial cells (Ep) with microvilli (Mv). Blood vessels (Bd) are distributed inside the connective tissue core. Scale bar = 20 μm. B, III: transmission electron microscopy (TEM) image of trophotaenia epithelial cells, which are distinguished by prominent vesicular structures indicative of a high level of endocytic activity. Microvilli are distributed on the apical surface of the cells. Yellow arrowheads indicate intracellular vesicles following endocytosis. N, nucleus. Scale bar = 2 μm. B, IV: schematic illustration of trophotaenia, depicting the epithelial cell layer and the connective tissue core containing blood vessels. C: transcripts per million (TPM) values of the genes selected from the RNA-Seq data analyzed in this study. D: immunostaining showing the cellular framework of trophotaenia epithelial cells, with their corresponding schematic illustrations. Green, F-actin, representing microvilli on apical surface. Red, Na+-K+-ATPase, representing basolateral boundary. Blue, Hoechst. Dotted lines indicate the outlines of the epithelial cells. Scale bar = 10 µm. E: immunostaining of trophotaenia with anti-VSP antibody (top) and control IgG (bottom); with corresponding schematic illustrations. VSP is localized in the apical region of trophotaenia epithelial cells. No signal was detected when control IgG was used as a negative control. Scale bar = 50 µm (left column) and 20 µm (middle and right columns). F: high-magnification images of trophotaenia, immunostained with anti-VSP antibody (top) and control IgG (bottom), focusing on the apical region of trophotaenia epithelial cells enriched with endocytic vesicles. Arrow, microvilli. *Endocytic vesicles. Scale bar = 20 µm |