- Title
-
Insight into the function of voltage-sensing phosphatase (VSP) in hind-gut derived pseudoplacenta of a viviparous teleost Xenotoca eiseni
- Authors
- Ratanayotha, A., Iida, A., Nomura, J., Hondo, E., Okamura, Y., Kawai, T.
- Source
- Full text @ Am. J. Physiol. Regul. Integr. Comp. Physiol.
|
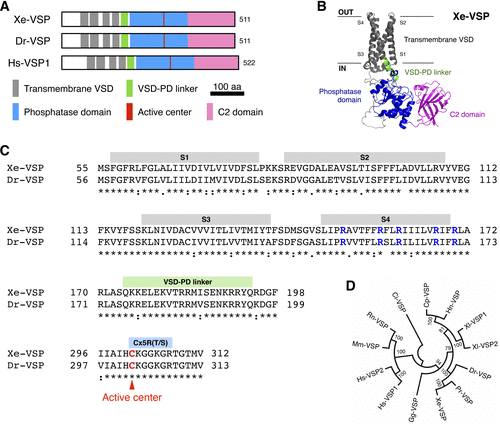
Molecular characterization of Xenotoca eiseni voltage-sensing phosphatase (Xe-VSP). A: schemes of the domain structures of X. eiseni VSP (Xe-VSP), zebrafish VSP (Dr-VSP), and human VSP1 (Hs-VSP1), demonstrating the conservation of functional domains across different species. Multiple amino acid alignment of full-length VSP orthologs is provided in Supplemental Fig. S1. B: predicted model of Xe-VSP, highlighting its key functional domains: transmembrane voltage-sensing domain (VSD) (gray), VSD-phosphatase domain (PD) linker (green), phosphatase domain (blue), and C2 domain (magenta). The average predicted local-distance difference tests (pLDDT) score = 87.2. C: amino acid sequence comparison of transmembrane VSDs, VSD-PD linkers, and Cx5R(T/S) motifs in the PDs of Xe-VSP and Dr-VSP. Symbolic conservation scores are indicated below the aligned sequences. Note that the S4 segments of both VSPs contain multiple positively charged arginine (R, highlighted in blue) intervened by hydrophobic residues. The Cx5R(T/S) motif, crucial for phosphatase enzyme activity, is highly conserved among VSPs. Red highlights a cysteine residue (C) within the active center of the PD that is required to form a cysteinyl-phosphate intermediate, a critical step in substrate dephosphorylation. D: phylogenetic tree showing the evolutionary relationships among VSP orthologs. Data were retrieved from NCBI public database and analyzed using the neighbor-joining method in MEGAX software. Ci, Ciona intestinalis Type A; Cp, Cynops pyrrhogaster; Dr, Danio rerio; Gg, Gallus gallus; Hn, Hynobius nebulosus; Hs, Homo sapiens, Mm, Mus musculus; Pr, Poecilia reticulata; Rn, Rattus norvegicus; Xe, Xenotoca eiseni; Xl, Xenopus laevis |
|
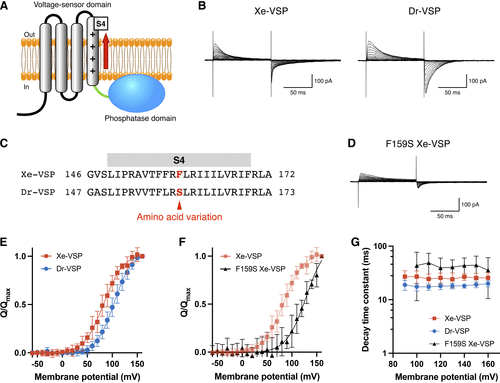
Voltage-sensing characteristics of Xenotoca eiseni voltage-sensing phosphatase (Xe-VSP). A: schematic illustration of an active state VSP. The voltage-sensing domain (VSD) detects membrane depolarization and undergoes conformational changes, generating voltage-dependent “sensing” currents associated with movement of the S4 segment. B: representative traces of sensing currents recorded from HEK293T cells expressing Xe-VSP (left) and zebrafish VSP (Dr-VSP, right). The holding potential was −60 mV. Depolarizing pulses of 100 ms were applied in 10-mV increments from −60 mV to 160 mV. The vertical scale bar indicates current amplitude, and the horizontal scale bar indicates duration. C: alignment of amino acid sequences in the S4 segments of Xe-VSP and Dr-VSP. Homologous amino acids with nonconservative variation are highlighted in red. D: representative traces of sensing currents recorded from a HEK293T cell expressing F159S Xe-VSP mutant. The holding potential and recording protocol were identical to those in B. The vertical scale bar indicates current amplitude, and the horizontal scale bar indicates duration. E: normalized charge-voltage (Q-V) relationship of OFF-sensing currents from Xe-VSP (red squares; n = 8) and Dr-VSP (blue circles; n = 8). Data are means ± SD. F: normalized Q-V relationship of OFF-sensing currents from Xe-VSP (red squares; n = 8) and F159S Xe-VSP (black triangles; n = 6). Data are means ± SD. G: decay time constant (τ) of OFF-sensing currents from Xe-VSP (red squares; n = 8), Dr-VSP (blue circles; n = 8), and F159S Xe-VSP (black triangles; n = 6) plotted against the depolarizing membrane voltage. Data are means ± SD. Note that the y-axis is calibrated in log scale. |
|
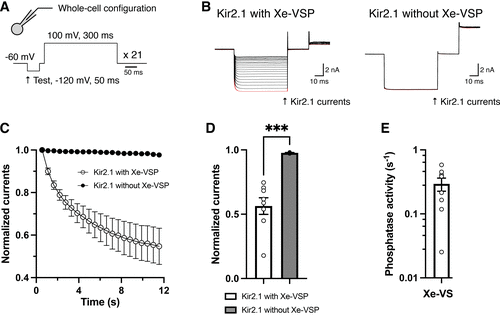
Phosphatase activity of Xenotoca eiseni voltage-sensing phosphatase (Xe-VSP). A: the pulse protocol for estimating VSP activity consisted of a 50-ms hyperpolarizing pulse to −120 mV (test pulse to measure Kir2.1 currents) followed by a 300-ms depolarizing pulse to 100 mV (to induce VSP enzyme activity). The holding potential was −60 mV. This protocol was repeated 21 cycles without an interval (20). B: representative traces of Kir2.1 currents recorded from HEK193T cells coexpressing Xe-VSP (left) and without Xe-VSP (right) in whole cell patch configuration. All 21 current traces were superimposed, with the first stimulation highlighted in red. The traces in this figure focus on Kir2.1 currents during the hyperpolarizing test pulse. Full traces are available in Supplemental Fig. S3. C: time-dependent changes in normalized Kir2.1 inward currents in the presence and absence of Xe-VSP. Unfilled circles, data with Xe-VSP (n = 8). Filled circles, data without Xe-VSP (n = 5). Values were measured at the end of the 50-ms hyperpolarizing pulses and were normalized by the current amplitude during the first stimulation. Data are means ± SE. D: comparison of normalized Kir2.1 inward currents in the presence and absence of Xe-VSP during the final stimulation (same data set as in C). Data are means ± SE. ***P = 0.0004; unpaired Student’s t test. E: phosphatase activities of Xe-VSP, estimated as rate constants for the decrease in normalized Kir2.1 currents with single exponential fitting. Fitting was applied to the dataset from each cell (n = 8). Data are means ± SE. Note that the y-axis is calibrated in log scale. |
|
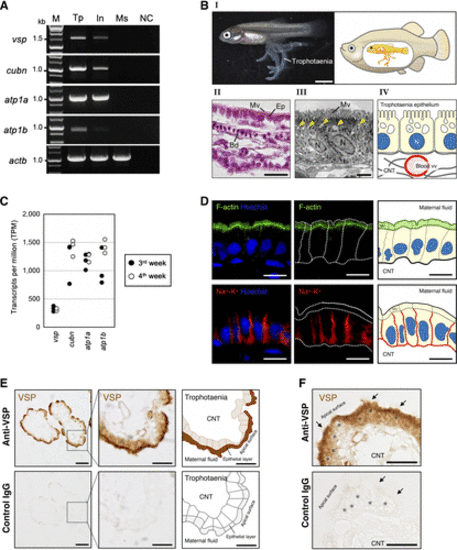
Voltage-sensing phosphatase (VSP) expression in Xenotoca eiseni trophotaenia. A: reverse transcription (RT)-PCR analysis of the VSP encoding gene (vsp) and additional target genes in selected tissues of X. eiseni. All amplicons were detected as a single band with the expected size, as determined by transcript sequences obtained from the de novo assembly. vsp, voltage-sensing phosphatase (VSP); cubn, cubilin; atp1a, Na+-K+-ATPase subunit α; atp1b, Na+-K+-ATPase subunit β; actb, actin β; M, marker; Tp, trophotaenia; In, adult intestine; Ms, adult muscle; NC, negative control (no DNA). B, I: morphological observation of trophotaenia in the intraovarian embryo of X. eiseni at 4 wk postfertilization (left). The embryo develops in the ovarian lumen of the mother fish (right). Trophotaenia is a continuous structure connected to the intestinal tract, functioning as an absorptive organ for maternal nutrients secreted into the ovarian lumen. Scale bar = 2 mm. B, II: sectional image of trophotaenia tissue stained with hematoxylin and eosin (H&E). Trophotaenia is surrounded by a monolayer of epithelial cells (Ep) with microvilli (Mv). Blood vessels (Bd) are distributed inside the connective tissue core. Scale bar = 20 μm. B, III: transmission electron microscopy (TEM) image of trophotaenia epithelial cells, which are distinguished by prominent vesicular structures indicative of a high level of endocytic activity. Microvilli are distributed on the apical surface of the cells. Yellow arrowheads indicate intracellular vesicles following endocytosis. N, nucleus. Scale bar = 2 μm. B, IV: schematic illustration of trophotaenia, depicting the epithelial cell layer and the connective tissue core containing blood vessels. C: transcripts per million (TPM) values of the genes selected from the RNA-Seq data analyzed in this study. D: immunostaining showing the cellular framework of trophotaenia epithelial cells, with their corresponding schematic illustrations. Green, F-actin, representing microvilli on apical surface. Red, Na+-K+-ATPase, representing basolateral boundary. Blue, Hoechst. Dotted lines indicate the outlines of the epithelial cells. Scale bar = 10 µm. E: immunostaining of trophotaenia with anti-VSP antibody (top) and control IgG (bottom); with corresponding schematic illustrations. VSP is localized in the apical region of trophotaenia epithelial cells. No signal was detected when control IgG was used as a negative control. Scale bar = 50 µm (left column) and 20 µm (middle and right columns). F: high-magnification images of trophotaenia, immunostained with anti-VSP antibody (top) and control IgG (bottom), focusing on the apical region of trophotaenia epithelial cells enriched with endocytic vesicles. Arrow, microvilli. *Endocytic vesicles. Scale bar = 20 µm |
|
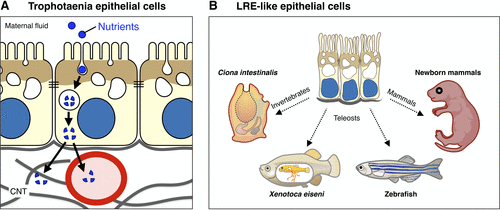
Potential role of voltage-sensing phosphatase (VSP) in trophotaenia epithelial cells and lysosome-rich enterocyte (LRE)-like epithelial cells among animal species. A: a functional model illustrating the absorption of maternal nutrients into trophotaenia through endocytosis in the epithelial cells. Xenotoca eiseni (Xe)-VSP (brown) is predominantly expressed in the apical region of the cells, potentially contributing to the endocytic activity. The absorbed substances are subsequently digested by proteolysis or lipolysis in the intracellular vesicles. B: schematic representation of LRE-like epithelial cells in diverse animal species. LRE-like epithelial cells with high endocytosis activity for nutrient absorption have been identified in absorptive tissues in a wide range of animal species, such as in Ciona intestinalis (digestive epithelium), X. eiseni (enterocytes and trophotaenia epithelium), zebrafish (LREs within the mid-intestine), and newborn mammals (enterocytes within the ileum). Note that VSP (brown) is associated with these LRE-like epithelial cells and has been experimentally validated in C. intestinalis, X. eiseni, and zebrafish. |

