|
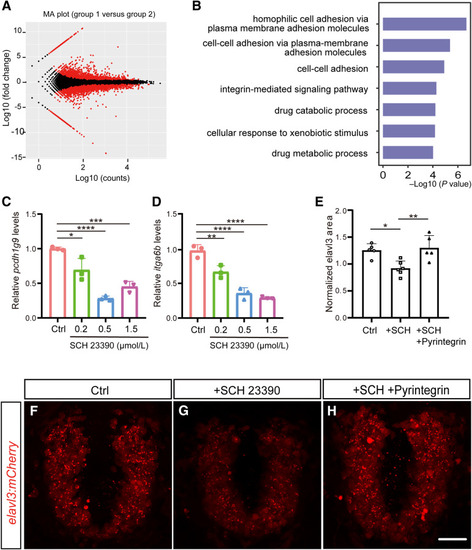
Potential targets of dopaminergic signaling during development. A: Volcano plots depicting the differentially expressed genes (DEGs) between control and SCH 23390–treated groups. B: Gene Ontology (GO) term analysis of DEGs between the control and SCH 23390–treated groups. GO terms are based on the Gene Ontology website (https://geneontology.org, last accessed August 2020). C and D: Relative mRNA levels of two cell adhesion molecules: pcdh1g9 and itga6b. E: Elavl3 normalized area showed significant differences between control (Ctrl) and SCH 23390 (SCH) groups. and between SCH+Pyrintegrin and SCH 23390 alone (Bonferroni multiple comparisons test, df = 13). Error bars represent SD. F–H: Live imaging of Tg(elavl3:mCherry) in the forebrain of the control, SCH 23390–treated group, and SCH 23390+Pyrintegrin–treated group. The embryo was oriented in rostral-caudal axis, and the rostral part was on top ∗P < 0.05, ∗∗P < 0.01, ∗∗∗P < 0.001, and ∗∗∗∗P < 0.0001. Scale bar = 50 μm.
|