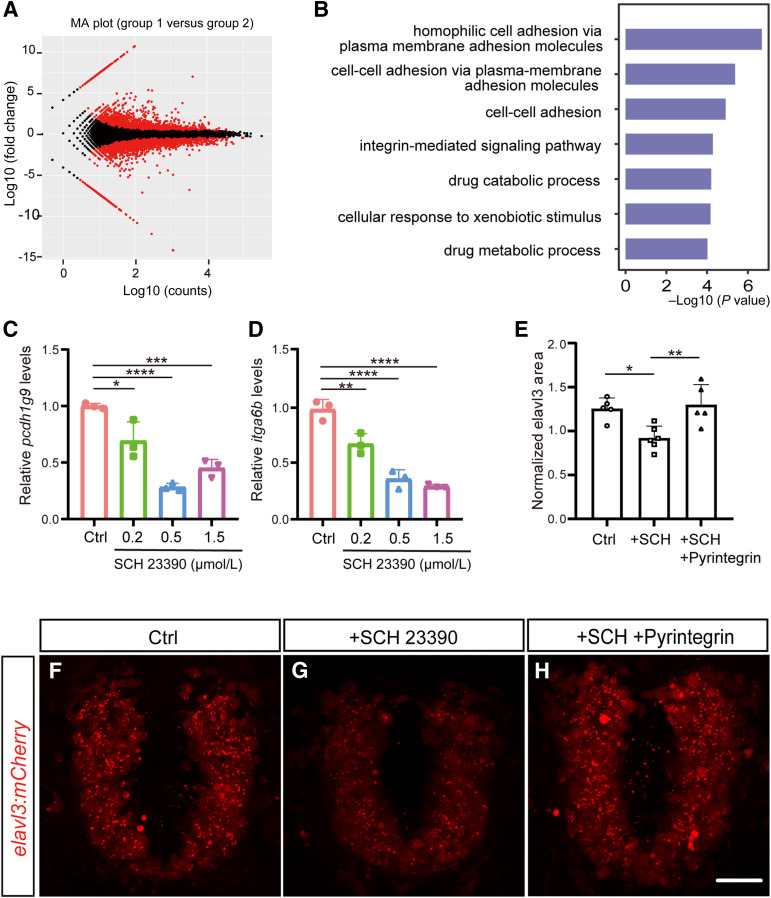
Fig. 7 Potential targets of dopaminergic signaling during development. A: Volcano plots depicting the differentially expressed genes (DEGs) between control and SCH 23390–treated groups. B: Gene Ontology (GO) term analysis of DEGs between the control and SCH 23390–treated groups. GO terms are based on the Gene Ontology website (https://geneontology.org, last accessed August 2020). C and D: Relative mRNA levels of two cell adhesion molecules: pcdh1g9 and itga6b. E: Elavl3 normalized area showed significant differences between control (Ctrl) and SCH 23390 (SCH) groups. and between SCH+Pyrintegrin and SCH 23390 alone (Bonferroni multiple comparisons test, df = 13). Error bars represent SD. F–H: Live imaging of Tg(elavl3:mCherry) in the forebrain of the control, SCH 23390–treated group, and SCH 23390+Pyrintegrin–treated group. The embryo was oriented in rostral-caudal axis, and the rostral part was on top ∗P < 0.05, ∗∗P < 0.01, ∗∗∗P < 0.001, and ∗∗∗∗P < 0.0001. Scale bar = 50 μm.
Image
Figure Caption
Figure Data
Acknowledgments
This image is the copyrighted work of the attributed author or publisher, and
ZFIN has permission only to display this image to its users.
Additional permissions should be obtained from the applicable author or publisher of the image.
Full text @ Am. J. Pathol.

