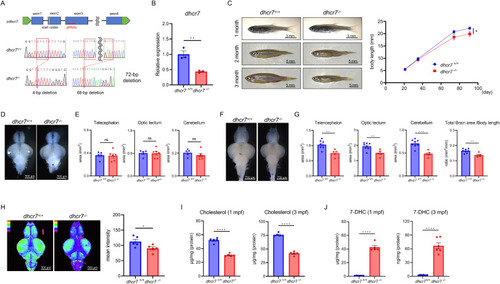
dhcr7−/− zebrafish show retarded growth, microcephaly, and changes in brain sterols (A) Schematic diagram for generating dhcr7−/− zebrafish using CRISPR/Cas9. (B) Relative mRNA expression of dhcr7 at 9 days post-fertilization in dhcr7+/+ and dhcr7−/− zebrafish larvae (n = 3, 6 larvae/sample). (C) Representative images and time course of body length in dhcr7+/+ (n = 12) and dhcr7−/− (n = 13) zebrafish. (D) Representative images of 1-month post-fertilization (mpf) dhcr7+/+ and dhcr7−/− zebrafish brains. (E) Measurement of the brain area in 1-mpf dhcr7+/+ (n = 5) and dhcr7−/− (n = 6) zebrafish. (F) Images of 3-mpf dhcr7+/+ and dhcr7−/− zebrafish brains. (G) Measurement of the brain area in 3-mpf dhcr7+/+ (n = 8) and dhcr7−/− (n = 5) zebrafish. The brain area adjusted for body length was calculated to assess microcephaly. (H) Heatmap images of filipin staining in 1-mpf dhcr7+/+ and dhcr7−/− zebrafish brains (n = 5 each). (I) Brain cholesterol in 1-mpf and 3-mpf dhcr7+/+ and dhcr7−/− zebrafish (n = 5 each). (J) Brain 7-DHC in 1-mpf (n = 5 each) and 3-mpf (n = 6 each) dhcr7+/+ and dhcr7−/− zebrafish. All values are presented as the mean ± SEM. *p < 0.05, **p < 0.01, ***p < 0.001, ****p < 0.0001. n.s: not significant. Microcephaly is the primary phenotype observed in patients with SLOS. No significant difference was found in the brain size of dhcr7−/− zebrafish at 1-mpf (Fig. 1D and E). However, differences in brain size in dhcr7−/− zebrafish became more pronounced as they grew. Their brains were significantly smaller than wild-type brains at 3-mpf (Fig. 1F and G). The levels of cholesterol and 7-DHC were assessed, and whole-mount filipin staining was performed on juvenile brains at 1-mpf. Cholesterol levels decreased significantly in dhcr7−/− zebrafish (Fig. 1H). We confirmed the decreased cholesterol in dhcr7−/− zebrafish brains using gas chromatography–mass spectrometry (GC–MS) in 1-mpf juvenile and 3-mpf adult zebrafish (Fig. 1I). In contrast, 7-DHC levels measured using liquid chromatography–mass spectrometry (LC–MS) were increased in dhcr7−/− zebrafish brains (Fig. 1J). These data are consistent with patients with SLOS, suggesting that dhcr7−/− zebrafish mimic the biochemical phenotype of human patients with SLOS. 3.2. Abnormalities in gfap+ neural stem cells in dhcr7−/− zebrafish We labeled mature neurons by mating dhcr7−/− zebrafish with huc promoter-driven Kaede fluorescent protein transgenic zebrafish [18]. The dorsal-view fluorescence intensity of mature neurons was significantly decreased in the telencephalon, optic tectum, and cerebellum of dhcr7−/− juvenile at 1-mpf, suggesting a decreased neuron density (Fig. 2A).
|
