
- Title
-
DHCR7 links cholesterol synthesis with neuronal development and axonal integrity
- Authors
- Miyazaki, S., Shimizu, N., Miyahara, H., Teranishi, H., Umeda, R., Yano, S., Shimada, T., Shiraishi, H., Komiya, K., Katoh, A., Yoshimura, A., Hanada, R., Hanada, T.
- Source
- Full text @ Biochem. Biophys. Res. Commun.
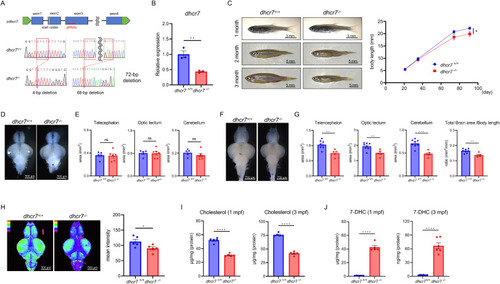
dhcr7−/− zebrafish show retarded growth, microcephaly, and changes in brain sterols (A) Schematic diagram for generating dhcr7−/− zebrafish using CRISPR/Cas9. (B) Relative mRNA expression of dhcr7 at 9 days post-fertilization in dhcr7+/+ and dhcr7−/− zebrafish larvae (n = 3, 6 larvae/sample). (C) Representative images and time course of body length in dhcr7+/+ (n = 12) and dhcr7−/− (n = 13) zebrafish. (D) Representative images of 1-month post-fertilization (mpf) dhcr7+/+ and dhcr7−/− zebrafish brains. (E) Measurement of the brain area in 1-mpf dhcr7+/+ (n = 5) and dhcr7−/− (n = 6) zebrafish. (F) Images of 3-mpf dhcr7+/+ and dhcr7−/− zebrafish brains. (G) Measurement of the brain area in 3-mpf dhcr7+/+ (n = 8) and dhcr7−/− (n = 5) zebrafish. The brain area adjusted for body length was calculated to assess microcephaly. (H) Heatmap images of filipin staining in 1-mpf dhcr7+/+ and dhcr7−/− zebrafish brains (n = 5 each). (I) Brain cholesterol in 1-mpf and 3-mpf dhcr7+/+ and dhcr7−/− zebrafish (n = 5 each). (J) Brain 7-DHC in 1-mpf (n = 5 each) and 3-mpf (n = 6 each) dhcr7+/+ and dhcr7−/− zebrafish. All values are presented as the mean ± SEM. *p < 0.05, **p < 0.01, ***p < 0.001, ****p < 0.0001. n.s: not significant. Microcephaly is the primary phenotype observed in patients with SLOS. No significant difference was found in the brain size of dhcr7−/− zebrafish at 1-mpf (Fig. 1D and E). However, differences in brain size in dhcr7−/− zebrafish became more pronounced as they grew. Their brains were significantly smaller than wild-type brains at 3-mpf (Fig. 1F and G). The levels of cholesterol and 7-DHC were assessed, and whole-mount filipin staining was performed on juvenile brains at 1-mpf. Cholesterol levels decreased significantly in dhcr7−/− zebrafish (Fig. 1H). We confirmed the decreased cholesterol in dhcr7−/− zebrafish brains using gas chromatography–mass spectrometry (GC–MS) in 1-mpf juvenile and 3-mpf adult zebrafish (Fig. 1I). In contrast, 7-DHC levels measured using liquid chromatography–mass spectrometry (LC–MS) were increased in dhcr7−/− zebrafish brains (Fig. 1J). These data are consistent with patients with SLOS, suggesting that dhcr7−/− zebrafish mimic the biochemical phenotype of human patients with SLOS. 3.2. Abnormalities in gfap+ neural stem cells in dhcr7−/− zebrafish We labeled mature neurons by mating dhcr7−/− zebrafish with huc promoter-driven Kaede fluorescent protein transgenic zebrafish [18]. The dorsal-view fluorescence intensity of mature neurons was significantly decreased in the telencephalon, optic tectum, and cerebellum of dhcr7−/− juvenile at 1-mpf, suggesting a decreased neuron density (Fig. 2A). |
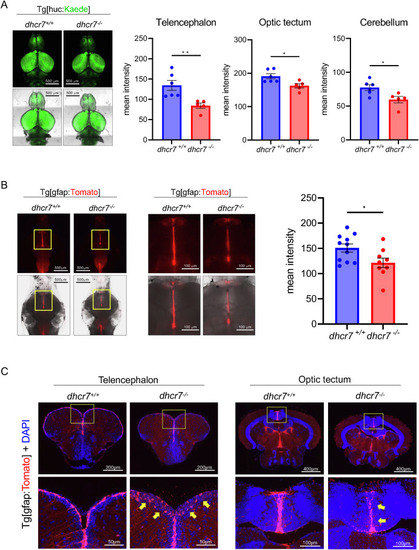
Decreased neurons and neural stem cells in dhcr7−/− zebrafish (A) Representative images of 1-mpf dhcr7+/+ (n = 6) and dhcr7−/− (n = 5) zebrafish brains in the Tg[huc:Kaede] background. (B) Images of 1-mpf dhcr7+/+ (n = 11) and dhcr7−/− (n = 9) zebrafish brain in the Tg[gfap:Tomato] background. (C) Images of transverse sections of 2-mpf dhcr7+/+ and dhcr7−/− zebrafish brains in the Tg[gfap:Tomato] background (red), stained with DAPI (blue). All values are presented as the mean ± SEM. *p < 0.05, **p < 0.01. (For interpretation of the references to colour in this figure legend, the reader is referred to the Web version of this article.) EXPRESSION / LABELING:
PHENOTYPE:
|
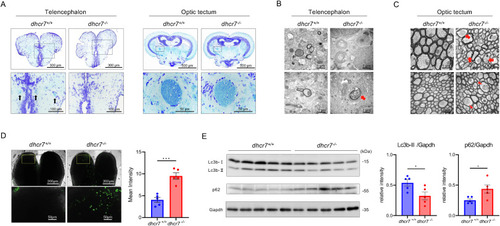
Impaired myelination and autophagy in dhcr7−/− zebrafish (A) Representative Klüver–Barrera staining of transverse sections of 3-mpf dhcr7+/+ and dhcr7−/− zebrafish telencephalon and optic tectum. Arrows indicate myelin stained in the dhcr7+/+ telencephalon. (B), (C) Representative transmission electron micrographs of the telencephalon (B) and optic tectum (C) from 2-mpf dhcr7+/+ and dhcr7−/− zebrafish. Arrows indicate axonal lysosome-like structures; arrowheads indicate mitochondria with indistinct cristae, which appeared expanded. (D) Lysosome staining by Lysoprime Green in 2-mpf dhcr7+/+ and dhcr7−/− zebrafish telencephalon (n = 5 each). (E) Western blot analysis of p62 and Lc3b protein levels in 2-mpf dhcr7+/+ and dhcr7−/− zebrafish brains (n = 5 each) relative to GAPDH. All values are presented as the mean ± SEM. *p < 0.05. (For interpretation of the references to colour in this figure legend, the reader is referred to the Web version of this article.) EXPRESSION / LABELING:
PHENOTYPE:
|
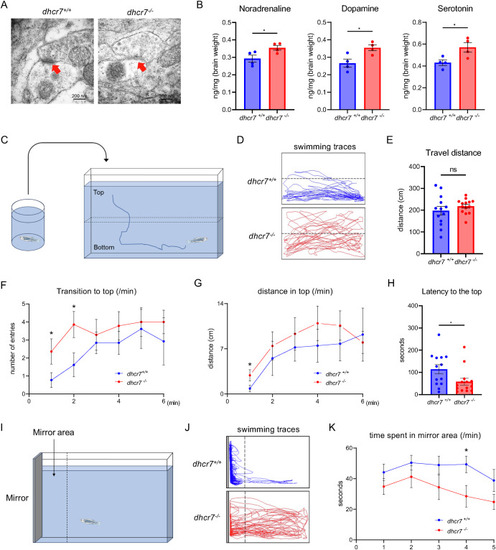
Synaptic defects and behavioral abnormalities in dhcr7−/− zebrafish (A) Transmission electron micrographs of the telencephalon from 2-mpf dhcr7+/+ and dhcr7−/−zebrafish. (B) Monoamine levels in the brains from 2-mpf dhcr7+/+ and dhcr7−/− zebrafish (n = 4 each). (C) Schematic illustration of the novel tank diving test. (D) Representative swimming traces of 2-mpf dhcr7+/+ and dhcr7−/− zebrafish for the first 2 min of the novel tank diving test. (E) Total swimming distance of 2-mpf dhcr7+/+ (n = 13) and dhcr7−/− (n = 14) zebrafish in 6 min. (F) The number of entries per min to the top half of the tank for 2-mpf dhcr7+/+ (n = 13) and dhcr7−/− (n = 14) zebrafish. (G) Swimming distance per min in the upper half of the tank for 2-mpf dhcr7+/+ (n = 13) and dhcr7−/− (n = 14) zebrafish. (H) Latency entering the tank's top half for 2-mpf dhcr7+/+ (n = 13) and dhcr7−/− (n = 14) zebrafish. (I) Schematic illustration of the mirror biting test. (J) Representative swimming traces of 2-mpf dhcr7+/+ and dhcr7−/− zebrafish for a 5 min mirror-biting test.(K) Time spent per min in the mirror area for 2-mpf dhcr7+/+ (n = 10) and dhcr7−/− (n = 9) zebrafish. All values are presented as the mean ± SEM. *p < 0.05, **p < 0.01. n.s: not significant. PHENOTYPE:
|

ZFIN is incorporating published figure images and captions as part of an ongoing project. Figures from some publications have not yet been curated, or are not available for display because of copyright restrictions. PHENOTYPE:
|
|
ZFIN is incorporating published figure images and captions as part of an ongoing project. Figures from some publications have not yet been curated, or are not available for display because of copyright restrictions. EXPRESSION / LABELING:
PHENOTYPE:
|