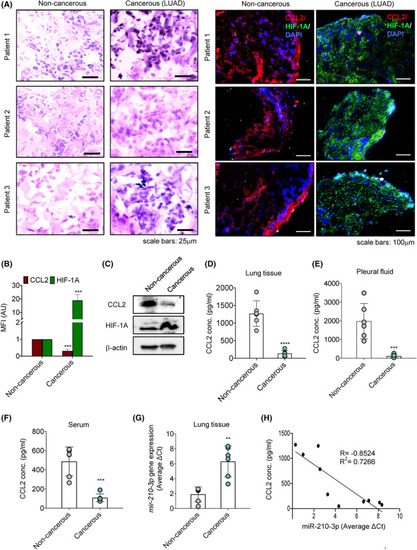
Hypoxic tumor microenvironment alters the expression of CCL2 and mir‐210‐3p in lung adenocarcinoma. (A) Hematoxylin and eosin (H&E) (left panel) and immunofluorescence (right panel) staining images of noncancerous (n = 3) and cancerous (lung adenocarcinoma, LUAD) (n = 3) tissue sections for visualization of morphology along with CCL2 (red) and HIF‐1A (green) protein levels. Nuclei were counterstained with DAPI (blue). Scale bars: 15 μm for H&E staining and 100 μm for immunofluorescence staining. Three images (N = 3) were taken from each sample. (B) The mean fluorescence intensity (MFI) of CCL2 and HIF‐1A levels in noncancerous and cancerous (LUAD) tissue sections of these patients were quantified as relative values of three patients (n = 3) and three values per sample (N = 3) using the imagej program and represented as a bar diagram. (C) Immunoblots showing the abundance of CCL2 and HIF‐1A proteins in noncancerous and cancerous (LUAD) tissue samples (n = 1). β‐Actin served as a loading control. (D–F) The concentration of CCL2 in 10 μg of tissue lysate (D), pleural fluid (E), and serum (F) of noncancerous (n = 6) and cancerous (LUAD) (n = 6) patients' samples were determined through ELISA. (G) RT‐qPCR analysis showing mir‐210‐3p gene expression in noncancerous (n = 6) and cancerous (LUAD) (n = 6) tissue samples. U6 snRNA was used as an internal reference control for miRNA normalization. (H) Inverse correlation between miR‐210‐3p mRNA and CCL2 protein expression in noncancerous and cancerous (LUAD) patient samples (P = 0.0017, Pearson r = −0.8524, r2 = 0.7266). Data represent mean ± SD. Statistical significance was analyzed by Student's t‐test. **P < 0.01, ***P < 0.001, and ****P < 0.0001 vs noncancerous.
|
