FIGURE SUMMARY
Title

Hypoxia-induced miR-210-3p expression in lung adenocarcinoma potentiates tumor development by regulating CCL2-mediated monocyte infiltration

Authors
Arora, L., Patra, D., Roy, S., Nanda, S., Singh, N., Verma, A.K., Chakraborti, A., Dasgupta, S., Pal, D.
Source
Full text @ Mol. Oncol.

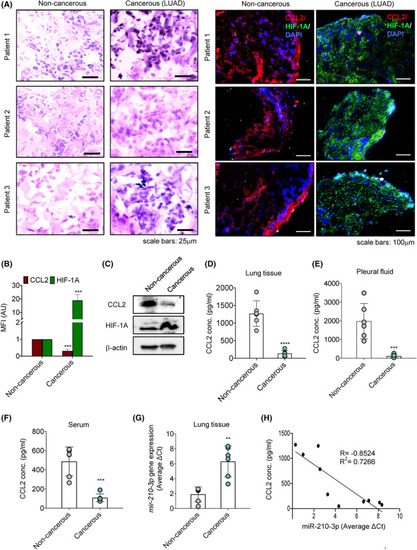
Hypoxic tumor microenvironment alters the expression of CCL2 and mir‐210‐3p in lung adenocarcinoma. (A) Hematoxylin and eosin (H&E) (left panel) and immunofluorescence (right panel) staining images of noncancerous (n = 3) and cancerous (lung adenocarcinoma, LUAD) (n = 3) tissue sections for visualization of morphology along with CCL2 (red) and HIF‐1A (green) protein levels. Nuclei were counterstained with DAPI (blue). Scale bars: 15 μm for H&E staining and 100 μm for immunofluorescence staining. Three images (N = 3) were taken from each sample. (B) The mean fluorescence intensity (MFI) of CCL2 and HIF‐1A levels in noncancerous and cancerous (LUAD) tissue sections of these patients were quantified as relative values of three patients (n = 3) and three values per sample (N = 3) using the imagej program and represented as a bar diagram. (C) Immunoblots showing the abundance of CCL2 and HIF‐1A proteins in noncancerous and cancerous (LUAD) tissue samples (n = 1). β‐Actin served as a loading control. (D–F) The concentration of CCL2 in 10 μg of tissue lysate (D), pleural fluid (E), and serum (F) of noncancerous (n = 6) and cancerous (LUAD) (n = 6) patients' samples were determined through ELISA. (G) RT‐qPCR analysis showing mir‐210‐3p gene expression in noncancerous (n = 6) and cancerous (LUAD) (n = 6) tissue samples. U6 snRNA was used as an internal reference control for miRNA normalization. (H) Inverse correlation between miR‐210‐3p mRNA and CCL2 protein expression in noncancerous and cancerous (LUAD) patient samples (P = 0.0017, Pearson r = −0.8524, r2 = 0.7266). Data represent mean ± SD. Statistical significance was analyzed by Student's t‐test. **P < 0.01, ***P < 0.001, and ****P < 0.0001 vs noncancerous.

Hypoxia‐induced miR‐210‐3p directly inhibits CCL2 expression attenuating monocyte infiltration in lung adenocarcinoma cell lines. (A) RT‐qPCR analysis indicating relative abundance of CCL2 mRNA levels in A549 and NCI‐H460 cell lines incubated with indicated levels of oxygen for 24 h. GAPDH was used as an internal loading control for normalization. Data represented as mean ± SD of three independent experiments. Statistical significance was analyzed by Student's t‐test, **P < 0.01 vs 21% oxygen. (B) Immunoblots showing the abundance of CCL2 and HIF‐1A proteins in A549 and NCI‐H460 cells treated with indicated concentrations of CoCl2. β‐Actin was served as a loading control. (C,D) Representative immunofluorescence images (20×, scale bars: 50 μm and 63×, scale bars: 10 μm) (C) and their quantifications (D) showing HIF‐1A (red) and CCL2 (green) levels in A549 cells incubated under normoxic and hypoxic conditions for 24 h, respectively. Data represent the mean ± SD of three independent experiments. Statistical significance was analyzed by Student's t‐test, ***P < 0.001 vs normoxia. (E) RT‐qPCR analysis showing mir‐210‐3p gene expression in A549 and NCI‐H460 cells incubated in normoxic and hypoxic conditions for 24 h. U6 snRNA was used as an internal reference control for miRNA normalization. Data represented as mean ± SD of three independent experiments. Statistical significance was analyzed by Student's t‐test, ***P < 0.001 vs normoxia. (F,G) miR target reporter luciferase assay showing relative luciferase activity in control vector, wildtype, and mutated CCL2‐3′UTR transfected A549 cells treated with control mimic or miR‐210‐3p mimic (F) or in wildtype CCL2‐3′UTR transfected A549 cells treated with miR‐210‐3p inhibitor or 60 nt long miR‐210‐3p target protector under normoxic and hypoxic conditions for 24 h (G). Data represent the mean ± SD of three independent experiments. Statistical significance was analyzed by two‐way ANOVA, ***P < 0.001, **P < 0.01. (H) RT‐qPCR analysis of mir‐210‐3p gene expression in A549 cells transfected with control mimic or miR‐210‐3p mimic. U6 snRNA was used as an internal reference control. Data represent the mean ± SD of three independent experiments. Statistical significance was analyzed by Student's t‐test, ****P < 0.0001 vs control mimic. (I,J) RT‐qPCR analysis of CCL2 gene expression (I) and ELISA showing CCL2 and HIF‐1A protein abundance (J) in control mimic or miR‐210‐3p mimic transfected A549 cells incubated with normoxic or hypoxic conditions for 24 h. GAPDH was used as a loading control for RT‐qPCR. Data represented as mean ± SD of three independent experiments. Statistical significance was analyzed by two‐way ANOVA, ***P < 0.001, **P < 0.01. (K) RT‐qPCR analysis of mir‐210‐3p gene expression in A549 cells transfected with control inhibitor or miR‐210‐3p inhibitor. U6 snRNA was used as an internal reference control. Data represent the mean ± SD of three independent experiments. Statistical significance was analyzed by Student's t‐test, ****P < 0.0001 vs control inhibitor. (L,M) RT‐qPCR analysis of CCL2 gene expression (L) and ELISA showing CCL2 protein abundance (M) in control inhibitor or miR‐210‐3p inhibitor transfected A549 cells treated with normoxic or hypoxic conditions for 24 h. GAPDH was used as a loading control for RT‐qPCR. Data represented as mean ± SD of three independent experiments. Statistical significance was analyzed by two‐way ANOVA, ***P < 0.001, **P < 0.01. (N,O) Representative images (N) and their quantifications (O) of THP‐1 monocytes migration from the upper surface to lower surface of transwell insert placed on the well containing A549 cells transfected without or with miR‐210‐3p mimic or miR‐210‐3p inhibitor and exposed to normoxic or hypoxic conditions for 16 h. Scale bars: 50 μm. Data represent the mean ± SD of three independent experiments. Statistical significance was analyzed by two‐way ANOVA, ****P < 0.0001, ***P < 0.001, **P < 0.01.

HIF‐1A regulates miR‐210‐3p mediated CCL2 inhibition and monocyte infiltration in hypoxic A549 lung adenocarcinoma cells. (A) Immunoblots (left panel) with densitometric plots (right panel) showing the abundance of CCL2 and HIF‐1A proteins in A549 cells transfected with scramble or HIF‐1A RNAi plasmid. Data represent the mean ± SD of three independent experiments. Statistical significance was analyzed by Student's t‐test, **P < 0.01 vs Scramble. (B,C) RT‐qPCR analysis of CCL2 gene expression (B), and ELISA showing CCL2 secretion into the culture medium (C) of A549 cells transfected with either scramble or HIF‐1A RNAi plasmid and incubated in 21% oxygen or 1% oxygen conditions for 24 h. Data represented as mean ± SD of three independent experiments. Statistical significance was analyzed by two‐way ANOVA, ****P < 0.0001, ***P < 0.001, **P < 0.01. (D) Immunoblots (left panel) with densitometric plots (right panel) showing the abundance of CCL2 and HIF‐1A proteins in A549 cells transfected with scramble plasmid and HIF‐1A‐ΟΕ (overexpression) plasmid. Data represented as mean ± SD of three independent experiments. Statistical significance was analyzed by Student's t‐test, ****P < 0.0001 vs Scramble. (E,F) RT‐qPCR analysis of relative CCL2 gene expression (E), and ELISA showing CCL2 secretion into the culture medium (F) of A549 cells transfected with either scramble plasmid or HIF‐1A‐OE (overexpression) plasmid and incubated in 21% oxygen or 1% oxygen conditions for 24 h. Data represented as mean ± SD of three independent experiments. Statistical significance was analyzed by two‐way ANOVA, ***P < 0.001, *P < 0.05, ns, nonsignificant. (G,H) Representative immunofluorescence images (G) and their quantifications (H) showing CCL2 (green) and HIF‐1A (red) protein levels in A549 cells transfected with scramble or HIF‐1A RNAi or HIF‐1A‐OE plasmid and incubated under normoxic and hypoxic conditions for 24 h, respectively. Scale bars: 15 μm. Data represent the mean ± SD of three independent experiments. Statistical significance was analyzed by two‐way ANOVA, ***P < 0.001, **P < 0.01. (I) RT‐qPCR analysis showing mir‐210‐3p gene expression in A549 cells transfected with scramble or HIF‐1A RNAi or HIF‐1A‐OE plasmid and incubated under normoxic and hypoxic conditions for 24 h, respectively. Data represent mean ± SD of three independent experiments. Statistical significance was analyzed by two‐way ANOVA, ****P < 0.0001, ***P < 0.001, *P < 0.05. (J) RT‐qPCR analysis showing relative CCL2 mRNA level in A549 cells transfected with scramble or HIF‐1A RNAi plasmid or HIF‐1A‐OE plasmid in the presence of miR‐210‐3p mimic (M) or miR‐210‐3p inhibitor (I) as indicated. Data represent mean ± SD of three independent experiments. Statistical significance was analyzed by one‐way ANOVA, **P < 0.01. (K,L) Representative images of THP‐1 monocytes migration (L) and their quantifications (K) from upper to lower surface of the transwell insert placed on the well containing A549 cells transfected with scramble or HIF‐1A RNAi or HIF‐1A‐OE plasmid in the presence of miR‐210‐3p mimic (M) or miR‐210‐3p inhibitor (I) as indicated. Scale bars: 50 μm. Data represent mean ± SD of three independent experiments. Statistical significance was analyzed by one‐way ANOVA, ****P < 0.0001.

Hypoxic tumor microenvironment in 3D lung adenocarcinoma spheroids regulates CCL2 mediated monocyte infiltration and promotes TAM polarization (A,B) Representative phase‐contrast (A), and Calcein‐AM fluorescence staining (B) images of 3D spheroids of BEAS‐2B, A549, and NCI‐H460 cells on day 10 showing THP‐1 monocytes infiltrations in normoxic and hypoxic conditions for 24 h. Scale bars: 100 μm. (C,D) Flow cytometric analysis of CD11b level (C) and its quantifications (D) indicated THP‐1 monocytes infiltration in 3D spheroids of BEAS‐2B or A549 or NCI‐H460 cells incubated in normoxic and hypoxic conditions for 24 h. (E,F) RT‐qPCR analysis showing the relative abundance of CCL2 (E), and mir‐210‐3p (F) gene expression in BEAS‐2B, A549, and NCI‐H460 cells spheroids under normoxic and hypoxic conditions. GAPDH and U6 snRNA were used as loading controls for CCL2, and mir‐210‐3p gene expression normalization, respectively. (G,H) RT‐qPCR analysis of CD206 (G), and CD163 (H) gene expression in BEAS‐2B, A549, and NCI‐H460 cell spheroids incubated with THP‐1 monocytes under normoxic and hypoxic conditions for 7 days. GAPDH was used as the loading control for normalization. (I) Representative phase‐contrast (upper panel) and Calcein‐AM fluorescence staining (lower panel) images of A549 cells spheroid transfected with control inhibitor or miR‐210‐3p inhibitor. Scale bars: 100 μm. (J) Flow cytometric analysis of CD11b level indicated THP‐1 monocytes infiltration in A549 cells spheroid transfected with control inhibitor or miR‐210‐3p inhibitor. (K,L) RT‐qPCR analysis of mir‐210‐3p (K) and CCL2 (L) gene expression in A549 cells spheroid transfected with control inhibitor or miR‐210‐3p inhibitor. GAPDH and U6 snRNA were used as loading controls for CCL2 and mir‐210‐3p gene expression normalization, respectively. Data represented as mean ± SD of three independent experiments. Statistical significance was analyzed by Student's t‐test, ****P < 0.0001, ***P < 0.001, **P < 0.01, *P < 0.05, ns, nonsignificant.

Anti‐miR‐210‐3p LNA delivery increases macrophage burden promoting tumor regression in the A549 lung cancer xenograft zebrafish model. (A) Schematic diagram representing experimental design indicating days of zebrafish A549 tumor xenograft model development followed by the administration of anti‐miR‐210‐3p LNA and collection of tumor tissue and blood samples from zebrafish. (B) Representative images of A549 tumor xenograft zebrafish (day 14/control) treated without or with anti‐miR‐210‐3p LNA for indicated timepoints (left panel) (n = 4) and the representative images of harvested tumors from these zebrafish (right panel). (C,D) Relative tumor growth (%) (C) and tumor weight (mg) (D) after treatment with anti‐miR‐210 LNA at indicated timepoints. (E,F) RT‐qPCR analysis of mir‐210‐3p (E) and CCL2 (F) gene expression in tumor xenografts treated without or with anti‐miR‐210‐3p LNA and harvested at day 3 (+d3) and day 5 (+d5) post‐treatment. U6 snRNA and β‐actin were used as loading controls for mir‐210‐3p and CCL2 gene expression normalization. (G,H) RT‐qPCR analysis showing relative abundance of MPEG1.1 (G) and MPX (H) mRNA levels in tumor xenografts treated without or with anti‐miR‐210‐3p LNA for day 3 (+d3) and day 5 (+d5). β‐actin was used as a loading control for gene expression normalization. Data represented as mean ± SD. Statistical significance was analyzed by Student's t‐test, *P < 0.05, **P < 0.01, ***P < 0.001 vs control; #P < 0.05, ##P < 0.01 vs +d3; ns, nonsignificant.

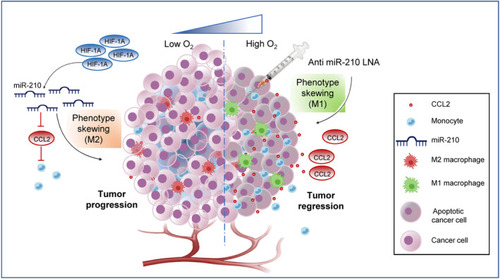
Model representing miR‐210‐3p as a potential therapeutic target for lung adenocarcinoma. Left panel: LUAD solid tumor exhibits hypoxia‐associated stabilization of HIF‐1A, which by promoting miR‐210‐3p level directly involved in downregulation of CCL2 and macrophage infiltration and also favors macrophage TAM phenotype supporting tumor progression. Right panel: Therapeutic intervention of anti‐miR210‐3p LNA augment CCL2 mediated monocyte infiltration and skewing towards macrophage antitumoral M1 phenotype leading to tumor regression.

Acknowledgments
This image is the copyrighted work of the attributed author or publisher, and ZFIN has permission only to display this image to its users. Additional permissions should be obtained from the applicable author or publisher of the image. Full text @ Mol. Oncol.